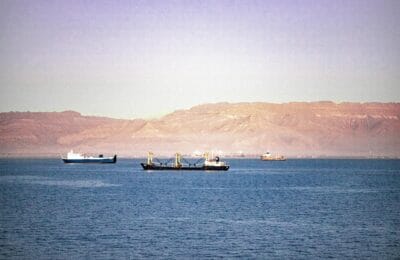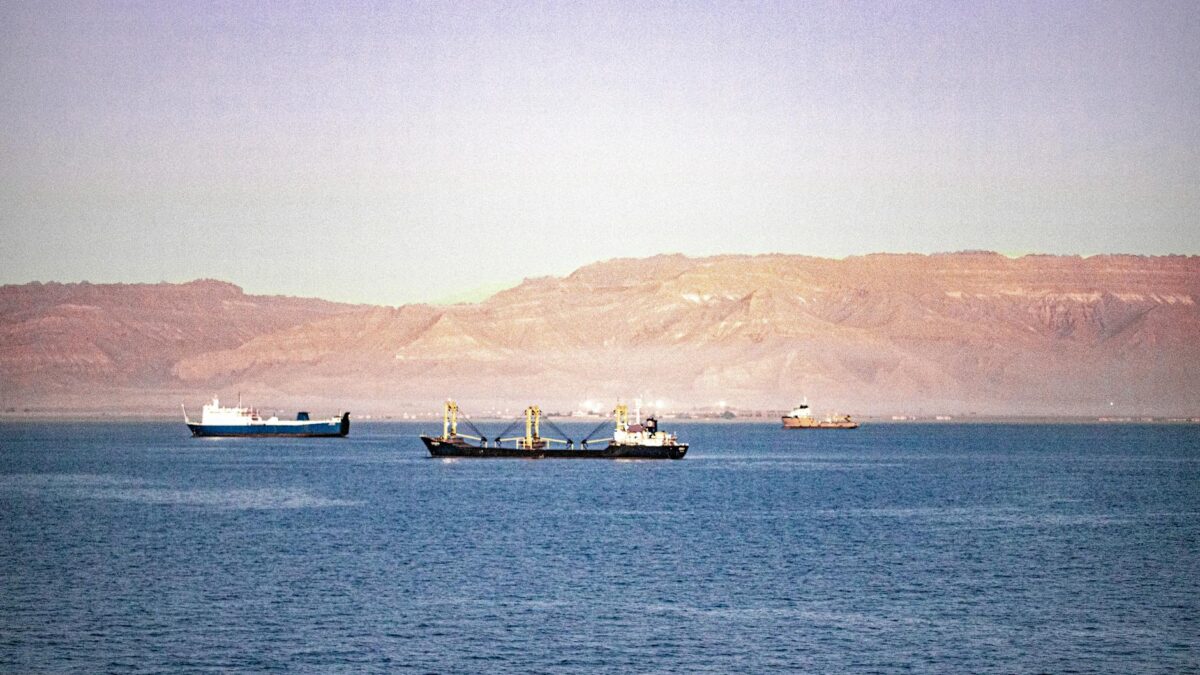
Two and a half years after Houthi missiles began landing on commercial shipping in the Red Sea, the disruption that briefly forced 60 percent of Asia-Europe container traffic around the Cape of Good Hope has receded to a manageable, but persistently elevated, state of risk. The Suez Canal is moving traffic again. Container rates have normalised, even if not fully. War-risk insurance is still priced higher than it should be. And the carriers, ports, and underwriters that adapted in 2024 are now adjusting to a market in which the Red Sea works most days, but never quite the way it did in 2022.
This is the picture as of April 2026 — what the data shows, where the residual risks sit, and what investors and shippers should be watching as the year develops.
The Disruption: A Short History
Houthi attacks on Red Sea shipping began in November 2023, in the weeks after the 7 October Hamas attack on Israel and the start of the Gaza ground campaign. The first incidents were isolated drone strikes; by January 2024 the campaign had escalated into sustained missile, drone, and uncrewed-surface-vessel attacks against commercial vessels transiting the Bab el-Mandeb chokepoint and the southern Red Sea. The cumulative tally for 2024 exceeded 60 vessel attacks, with two crew fatalities and the sinking of the Rubymar bulk carrier in March 2024.

The shipping industry’s response was rapid and decisive. Maersk, the world’s second-largest container line, suspended Red Sea transits on 15 December 2023 after one of its vessels was struck by a missile. MSC, CMA CGM, Hapag-Lloyd, ONE, and Evergreen followed within days. By February 2024, between 40 and 60 percent of normal Suez container traffic had been rerouted around the Cape of Good Hope, adding 10 to 14 days and approximately 3,500 nautical miles to the round-trip Asia-Europe voyage.
The military response came in two layers. The United States led Operation Prosperity Guardian, a multinational task force operating under Combined Task Force 153, focused on intercepting incoming missiles and drones over the southern Red Sea. The European Union launched EUNAVFOR Aspides in February 2024, a parallel mission with rules of engagement narrower than the US-led effort but contributing escort capacity to specific high-value transits. India, China, and Egypt all maintained additional naval presence in the wider region.
Between mid-2024 and early 2025, three things changed. First, US and allied air defences proved consistently effective at intercepting Houthi standoff weapons; the cost-exchange ratio favoured the defender even though individual interceptors are expensive. Second, the Houthi capability set ran into ammunition and supply-chain limits that constrained the tempo of operations. Third, the Israel-Hamas ceasefire framework — though imperfect and repeatedly tested — removed the public political rationale Ansar Allah leadership had used to frame the campaign as solidarity with Gaza. Reuters reporting through late 2025 documented a sharp month-on-month decline in attempted attacks, and by Q1 2026 the southern Red Sea has seen only sporadic, low-tempo incidents.
The Suez Number That Matters
The cleanest summary of the disruption and the recovery sits in the Suez Canal Authority transit register.
| Year | Vessel transits | Change vs prior year | Canal revenue ($B) |
|---|---|---|---|
| 2022 | 23,851 | — | 8.0 |
| 2023 | 26,434 | +10.8% | 9.4 |
| 2024 | 14,500 | -44.7% | 5.0 |
| 2025 | ~21,000 | +44.8% | ~7.0 |
| 2026 (forecast) | 24,000+ | +14.3% | 8.5+ |
The 2024 collapse pulled Suez revenues back to the lowest level in roughly a decade in nominal terms — and a much deeper hole in real terms once Egyptian-pound depreciation is accounted for. The hard-currency hit was material enough that it counted as one of the precipitating factors in the IMF’s expanded rescue package for Egypt, which lifted the Extended Fund Facility to $8 billion in March 2024 and unlocked parallel commitments from the World Bank and the European Union.
The 2025 recovery to roughly $7 billion was partial because two effects ran simultaneously: Suez had to win back the cargo that had switched to Cape routings, and several container lines deliberately rebuilt in stages rather than swing fleets back en masse. Maersk’s public statements through 2025 — covered in detail by Bloomberg — described “phased” return-to-Red-Sea programmes, with named vessels reassigned only after risk reviews and underwriter sign-off. By the end of 2025, those phased programmes had restored most lost transits, though residual capacity still routes via the Cape on selected sailings.
The Two-Route Decision
For a shipping line running an Asia-Europe loop, the choice between the Suez and Cape routes is a continuous economic calculation, not a political statement. The cost components break down as follows.
| Cost element | Suez routing | Cape routing |
|---|---|---|
| Round-trip distance | ~22,000 nm | ~25,500 nm |
| Round-trip time | 56-60 days | 70-74 days |
| Bunker fuel cost | ~$2.4M | ~$3.4M |
| Suez Canal toll | $700K-$1.2M | $0 |
| War risk insurance premium | 0.15-0.40% of hull value | ~0% |
| Cargo insurance surcharge | $50-$200/TEU | ~$0 |
| Asset-rotation cost | baseline | ~25% more vessels needed |
At 2024 disruption-peak insurance levels — when war-risk hull premiums reached 0.7 percent of the hull-and-machinery value for some Israeli-linked or US-linked tonnage — the Cape route was clearly the cheaper option for many sailings, even before factoring in safety considerations. The maths flipped back as insurance premiums settled to 0.15-0.25 percent for unaffiliated tonnage and Suez tolls were recalibrated; by mid-2025 the Suez route was once again the lowest-cost option for most laden Asia-Europe traffic.
The carriers that managed this transition best were those with the largest fleet flexibility. Maersk and MSC, with combined fleet capacity exceeding 12 million TEU, could absorb a 25 percent rotation increase without compromising service frequency by ordering ships off lay-up and accelerating delivery on newbuilds. Hapag-Lloyd and ONE, smaller in absolute capacity, leaned more heavily on slot-sharing arrangements through the Gemini and THE Alliance. CMA CGM occupied an intermediate position. The lines that struggled most were mid-size operators without alliance integration; several saw service frequency drop and either suspended specific lanes or merged them with alliance partners.
Container Spot Rates: From Spike to Settle
Asia-Europe container spot rates are the cleanest market signal of the disruption. The Shanghai Containerised Freight Index for the Asia-Northern Europe lane spent most of 2022 around $1,200-$1,800 per TEU. Through 2023, with overcapacity weighing, the index sat at $700-$1,200. In late December 2023 and through Q1 2024, as Cape rerouting bit and capacity tightened, the index spiked to $4,000-$5,500 per TEU on the index, with quoted spot rates on premium services exceeding $8,000 per TEU at the worst. Some short-window tenders cleared above $12,000 per TEU.
| Period | Asia-N. Europe spot ($/TEU) | Asia-Med spot ($/TEU) | Trans-Pacific spot ($/FEU) |
|---|---|---|---|
| 2023 average | ~1,000 | ~1,200 | ~1,800 |
| Q1 2024 peak | 4,500 | 5,800 | 5,200 |
| Q3 2024 | 2,800 | 3,400 | 4,800 |
| Q1 2025 | 2,000 | 2,400 | 3,200 |
| Q1 2026 | ~1,800 | ~2,100 | ~2,500 |
The settling pattern is meaningful in two respects. First, the Q1 2026 levels are still elevated by 30-60 percent versus the pre-disruption baseline, suggesting that some structural costs — higher insurance, more capacity tied up in longer rotations, and a permanent risk premium — have not fully washed out. Second, trans-Pacific rates moved despite the Pacific being unaffected by Red Sea disruption directly, because global container capacity is fungible and the Asia-Europe diversion drained free capacity from other lanes.
The Wall Street Journal’s coverage through this cycle, summarised in WSJ Logistics reporting, made the operational point that ports themselves were under pressure — Antwerp, Rotterdam, and Hamburg saw congestion rise as Cape-routed vessels arrived in unscheduled clusters, and the cascading port-stay extensions added another 4-7 days of effective transit on top of the routing diversion itself.
Oil Tankers, War Risk, and Brent
The crude and product tanker market traversed the same shape of disruption as containers, but the price signal was filtered through a different mechanism. Tanker freight rates respond to vessel demand and bunker cost; the Red Sea disruption drove both up simultaneously. The VLCC Middle East-to-Europe rate climbed roughly 40-50 percent through Q1 2024 versus 2023 averages. Suezmax day-rates ran 30-40 percent higher. Smaller product tankers carrying refined fuels saw the largest percentage rate gains.
Brent crude carried a geopolitical risk premium estimated by the International Energy Agency and cited in Financial Times commentary at $5 to $15 per barrel during the worst weeks of disruption. The premium fluctuated with attack tempo and was not solely about Red Sea tankers — Israel-Iran exchanges, the Iran sanctions cycle, and the broader Middle East risk picture all contributed. The base picture in 2026 is a normalised tanker market, with day-rates near five-year averages and a residual war-risk premium of roughly $1 to $3 per barrel built into Brent versus an undisrupted counterfactual. The full sanctions and price arc is detailed in the Iran oil export sanctions April 2026 update and in the global oil demand 2030 forecast, both of which fold the Red Sea risk into broader market modelling.
For oil exporters in the Gulf, the Red Sea calculus is asymmetric. Saudi crude flows to Europe transit either via the Sumed pipeline (which bypasses the Suez Canal at the southern end of the Red Sea but still crosses the Bab el-Mandeb threat zone) or by full Suez transit. Iraqi exports from Basra face the same routing. Qatari LNG transits the Bab el-Mandeb on the way to European regasification terminals; the Qatar LNG North Field expansion analysis details how that exposure intersects with the broader long-term contract book.
Egypt: The Macro Hit and the Recovery
The Suez Canal is one of Egypt’s three principal hard-currency sources, alongside tourism and remittances. The 47 percent revenue drop in 2024 — from $9.4 billion to $5.0 billion — translated to roughly $4.4 billion of foregone foreign-exchange earnings in a single year. Coming on top of pre-existing strain in the Egyptian external accounts, the loss was material to the IMF programme expansion and to the parallel UAE investment in the Ras El-Hekma development on the Mediterranean coast that injected $35 billion of fresh foreign capital.
The recovery in 2025 to approximately $7 billion of canal revenue restored most of the macro stability. The 2026 forecast of $8.5 billion-plus, if delivered, would put Suez revenue back within touching distance of the 2023 high. The structural risk for Egypt is the underlying recognition that single-chokepoint dependence is a long-tailed exposure, and that diversification of Egypt’s export economy is a strategic necessity rather than a long-run preference.
The DP World 2026 port empire analysis covers the parallel story for Sokhna and the Suez Canal Economic Zone — DP World’s Egyptian operations gained throughput as Asia-Europe transhipment rerouted through Sokhna for breakbulk and project cargo even when canal volumes themselves were depressed. The recovery in 2026 brings full transhipment activity back online, and the SCZONE’s longer-term industrialisation pipeline — focused on logistics-intensive manufacturing and green hydrogen — is structurally positioned to capture more value-added activity than pure transit ever did.
Insurance: The Slowest Variable to Normalise
War-risk insurance is the layer of the Red Sea cost stack that has taken the longest to settle. The London-based Joint War Committee added the southern Red Sea, the Gulf of Aden, and parts of the Arabian Sea to its high-risk-area list in late 2023; specific zones have been periodically expanded and contracted as the threat picture has evolved. War-risk hull premiums are quoted as a percentage of the hull-and-machinery sum insured, applied per voyage transit through the listed area.
| Period | War-risk hull premium (% of H&M sum insured per transit) |
|---|---|
| 2022 | 0.02-0.05% |
| Q1 2024 peak | 0.50-0.70% |
| Q3 2024 | 0.40-0.55% |
| Q1 2025 | 0.25-0.35% |
| Q1 2026 | 0.15-0.25% |
For a typical container vessel with a hull-and-machinery sum insured of $150 million, a 0.20 percent war-risk premium per transit is $300,000. Two transits per Asia-Europe round trip and 5-6 round trips per year per vessel produces $3-3.6 million of annual war-risk cost — a meaningful but absorbable charge against an EBITDA stream that for major lines runs $150-$250 million per vessel per year at current freight rates. The insurance cost has dropped to where it no longer drives Cape rerouting decisions, but it remains many multiples of the pre-disruption baseline.
Cargo insurance has tracked a similar shape. Surcharges on cargo war-risk policies for transits through the listed area peaked at $200-$400 per TEU in early 2024 and have settled at roughly $50-$100 per TEU in 2026. The cumulative cost over a contracted shipping book is non-trivial; large beneficial cargo owners have been able to negotiate bundled premiums that price the residual risk more efficiently than spot-quoted policies.
Bab el-Mandeb and Suez: The Chokepoint Math
Approximately 12 percent of global maritime trade by volume transits the Bab el-Mandeb strait at the southern end of the Red Sea. Approximately 12 percent of global trade by value passes through the Suez Canal at the northern end — a near-identical share by different measures. The two figures overlap heavily but not perfectly: bulk crude tankers using the Sumed pipeline bypass the canal but still cross the Bab el-Mandeb; some Suez transits originate in the Mediterranean and never approach the southern threat zone.
The chokepoint sensitivity is the underlying reason the Red Sea disruption mattered globally and not just regionally. Comparable chokepoint exposures elsewhere — the Strait of Hormuz handles roughly 21 percent of global oil trade, the Strait of Malacca approximately 25 percent of global maritime trade — define the upper bound of single-point disruption risk. The Red Sea disruption was severe enough to materially affect global rate structures even though its share of global trade is closer to half that of Hormuz or Malacca.
The implication for risk management is twofold. First, redundant routing is structurally valuable; the Cape of Good Hope is the natural backup for the Red Sea, but it adds 25 percent more sailing time and burns 40 percent more bunker fuel. Second, the global container fleet is no longer sized for full Cape rerouting indefinitely — extended disruption requires new fleet investment, not just rotation. The newbuild order books at Hyundai Heavy Industries, Daewoo Shipbuilding, Samsung Heavy Industries, and the Chinese yards expanded materially in 2024 partly as a hedge against repeat disruption scenarios.
Carrier-by-Carrier: Where the Margin Sits
Maersk (MAERSK-B). The Danish line was first to suspend Red Sea transits in December 2023 and most public about its phased return through 2024 and 2025. Its 2024 EBITDA benefited substantially from the freight-rate spike — Q1 2024 EBITDA was $2.0 billion versus $0.7 billion in Q1 2023 — but the costs of Cape rerouting and capacity strain offset some of the upside. By 2026, Maersk’s commentary has shifted to a normalisation narrative, with full-year guidance assuming Suez routing as the base case and Cape diversion only on specific risk-elevated sailings.
Hapag-Lloyd (HLAG). The Hamburg-listed line saw similar earnings volatility. Net profit swung from €3.2 billion in 2023 to €2.8 billion in 2024 as freight-rate gains were partly offset by operating-cost inflation. The 2025 result narrowed further as rates settled. Hapag-Lloyd’s exposure is heavier on Asia-Europe than its peer group, making it more sensitive to Red Sea normalisation.
CMA CGM. The privately held French line — owned by the Saadé family — does not disclose detailed quarterly numbers but is broadly understood to have outperformed peer averages on freight-rate gains given its premium positioning on Asia-Europe and its strong North Africa franchise. The private structure gave CMA CGM more flexibility on pricing and contract structure than the listed peers.
MSC. The Geneva-headquartered private line, the world’s largest by capacity since 2022, also does not publish quarterly accounts. MSC’s strategy through the disruption emphasised continuity of service even at premium cost, capturing market-share gains from rivals that suspended sailings more aggressively.
Chinese carriers (COSCO Shipping, Cosco Container Lines). The Chinese state lines maintained more Red Sea sailings through the worst of the disruption than their Western peers, reflecting the Houthi statements that Chinese-affiliated vessels would not be targeted. The competitive effect was meaningful — COSCO’s Asia-Europe market share rose during 2024, and the operational baseline for Chinese supply chains carried less of the disruption cost than European supply chains did.
The Investor Map for 2026
The companies and assets most exposed to Red Sea normalisation versus repeat disruption fall into clear groups.
Beneficiaries of normalisation: Egyptian sovereign and SCZONE-linked instruments, DP World Sokhna throughput, Suez Canal Authority bond spreads, Maersk and Hapag-Lloyd margin recovery on bunker and asset-rotation cost normalisation, Mediterranean ports including Piraeus and Damietta as transhipment hubs, and Egyptian pound stability via restored hard-currency inflow.
Beneficiaries of repeat disruption: South African ports (Durban, Cape Town) on increased Cape rerouting volume, Egyptian Mediterranean rail and Red Sea Mediterranean pipeline alternatives, container lines positioned to capture spot-rate windfalls, war-risk underwriters at Lloyd’s of London on premium expansion, and shipbuilders on hedge-driven newbuild order pickup.
Net-neutral or asymmetric exposures: Saudi Aramco (some shipping via Sumed pipeline mitigates Bab el-Mandeb exposure), QatarEnergy LNG (full Bab el-Mandeb exposure on European cargoes; Asia routes unaffected), and the GCC ports along the Strait of Hormuz (correlation with Red Sea risk is low to moderate).
What to Watch Through 2026
The base case of continued normalisation rests on the durability of the Israel-Hamas ceasefire framework, the operational effectiveness of allied naval presence, and the constraints on Houthi capability replacement. Each of those can move.
The data points worth tracking are the Suez Canal Authority’s monthly transit count (a leading indicator of carrier confidence), the Joint War Committee’s high-risk-area listing changes (immediate insurance signal), and the Asia-Europe spot-rate index (which captures the integrated effect on rerouting and capacity decisions). Bloomberg’s Red Sea attack tracker is the cleanest tempo indicator on the security side; FT and Reuters maritime coverage carries the contractual and insurance detail.
The downside-case trigger most worth modelling is a sustained breakdown of the Israel-Hamas ceasefire that revives the public political rationale for renewed Houthi attacks. The Iran factor is secondary — direct Iranian provision of advanced weapons systems to the Houthis has been visible throughout the cycle, but the political driver of attack tempo has tracked more closely to the Israel-Gaza dynamic than to the broader Iran-Saudi or Iran-US relationship. A renewed Gaza escalation, more than a renewed Iran escalation, is the most plausible path back to a 2024-style disruption profile.
Bunker Fuel and the Hidden Cost of Cape Routing
Bunker fuel is the largest single variable cost in maritime shipping, and the Cape route penalty is most visible in the bunker bill. A modern 18,000-TEU container vessel consumes approximately 200 tonnes of very low sulphur fuel oil per day at typical service speed. Adding 14 days to a round-trip — the average penalty for Cape rerouting from East Asian load ports to Northern European discharge ports — translates to roughly 2,800 additional tonnes of bunker fuel per voyage. At the 2024 average VLSFO bunker price of approximately $625 per tonne in Singapore, that is $1.75 million of additional fuel cost per round trip per vessel.
Multiplied across a typical Asia-Europe trade lane that requires 11 to 12 vessels for a weekly service, the annual fuel-cost penalty for sustained Cape routing approached $200 million per service per year through 2024. The figure understates the true economic impact because it excludes the ancillary costs of port congestion at the West African bunker hubs (Las Palmas, Cape Verde) where Cape-routed vessels stopped for refuelling, and because it does not capture the carbon-intensity penalty under the EU Emissions Trading System that began applying to maritime shipping in January 2024. The ETS surcharge added an estimated $40-$80 per TEU on Cape-routed Asia-Europe sailings during 2024 — a cost that flowed through to shippers via dedicated bunker and emissions surcharges quoted alongside base freight rates.
The fuel-cost element is also the slowest variable to remove from the cost stack as routings normalise. Vessels returning to Suez routings still carry the higher steaming-speed habits and the operational profile adapted to Cape rotations; the optimisation back to Suez-baseline operations has taken several quarters as schedule patterns rebuild. By Q1 2026, the bunker-cost premium for the residual Cape sailings has compressed to a fraction of the 2024 peak but remains a non-trivial line on carrier P&L statements.
Port-Level Impact: Where the Cargo Actually Moved
The cargo that did not transit the Suez Canal in 2024 did not vanish — it moved through different ports, transhipped at different hubs, and occasionally landed via different feeder lanes. Tracking those flows reveals where the operational dislocation showed up most acutely.
The Mediterranean transhipment hubs were the largest beneficiaries on the volume side. Piraeus (operated by COSCO Shipping Ports), Tanger Med (Morocco), and Algeciras (Spain) saw transhipment volumes rise materially through 2024 as Cape-routed vessels arrived in Mediterranean waters and discharged onto feeder networks for onward delivery to Northern European ports. Piraeus throughput grew an estimated 12 percent year-over-year in 2024, with the gain almost entirely attributable to disrupted Asia-Europe transhipment patterns. Tanger Med’s share of westbound Asia-Europe cargo also climbed, though its base is smaller.
The Northern European hub ports — Rotterdam, Antwerp, Hamburg, and Le Havre — saw a different shape of disruption. Direct calls from East Asia continued, but vessels arrived in clustered patterns that strained terminal capacity and quay-crane allocation. Rotterdam reported elevated vessel waiting times and intra-port congestion through much of 2024; Antwerp’s data showed similar pressure. The cumulative effect was to add 4-7 days of effective transit time on top of the routing penalty itself, as documented in Reuters supply-chain reporting.
South African ports — Durban, Cape Town, and Port Elizabeth — saw the most dramatic Cape-routing transit boost. Cape Town anchorage queues during peak diversion months sometimes carried 20-plus vessels waiting for fuel, supplies, or crew swaps. Bunker shortages at Cape Town in early 2024 forced some vessels to detour to Walvis Bay (Namibia) or to ride out anchorage waits at Durban. Port-services economics through 2024 showed materially elevated activity for ship-supply, agency, and ship-husbandry firms in the region.
Crew, Welfare, and the Human Layer of the Disruption
The Red Sea disruption affected seafarers as directly as it affected charterers and underwriters. The International Transport Workers’ Federation and the International Chamber of Shipping issued multiple statements through 2023-2024 pressing for hazard pay, the right to refuse to transit the listed area, and improved evacuation and casualty protocols. Crew compensation for transits of the high-risk area rose to a typical bonus of $5,000-$15,000 per voyage transit per officer and $2,000-$8,000 per rating, layered on top of base wages.
The seafarer-welfare layer also drove operational decisions that did not show up in pure economic models. Several Indian and Filipino crewing agencies — which together supply the majority of officers and ratings on Asia-Europe-trading vessels — declined to deploy crew on confirmed Red Sea transits during the worst of the disruption, forcing some operators to switch crew nationalities or alter rotation patterns. The cumulative effect was a tightening of the qualified seafarer market that propagated into operating-cost inflation across the wider container, tanker, and dry-bulk segments well beyond the immediate Red Sea exposure.
By 2026, hazard-pay protocols remain in place but at reduced bonus levels reflecting the lower threat tempo. The structural lesson — that crew protection clauses in collective agreements need to be more responsive to evolving risk pictures — is being incorporated into the 2026-2027 round of seafarer collective bargaining negotiations across the major flag states.
Where the Recovery Hits Its Ceiling
The Suez recovery to roughly 75 percent of pre-disruption volumes raises an immediate question: why not 100 percent? Three structural reasons explain the residual gap.
First, some carriers have permanently absorbed Cape rerouting into their network design as a redundancy layer. Maersk’s Gemini Cooperation network, launched in early 2025 with Hapag-Lloyd, was structured around a hub-and-spoke architecture less dependent on the East-West direct corridor and therefore more resilient to single-chokepoint disruption. The architecture accepts a slightly higher steaming time on average in exchange for service reliability — a trade-off that some shippers are willing to pay for at the contract level.
Second, war-risk insurance pricing has not fully reverted, and certain charterers — particularly those carrying US-linked, Israeli-linked, or UK-linked cargo — face higher premiums than the market average. The result is a structural tilt of those specific cargoes toward Cape routings even when the broader market is using Suez. The volume effect is not large in absolute terms but it is persistent.
Third, residual security concerns shape contracting. Cargo insurance policies often specify minimum routing requirements, and shippers with high-value or politically sensitive cargo continue to specify Cape-route options in the contract terms. As long as the Joint War Committee retains the southern Red Sea on its high-risk list — which is unchanged as of April 2026 — those clauses remain triggered.
The combined effect is a 2026 Suez transit profile that probably tops out near 90-95 percent of the 2023 peak even under fully benign security conditions. Closing the last 5-10 percent gap requires either delisting from the high-risk area register or a structural shift in which carrier networks reabsorb the Cape redundancy out of their operational design.
The Bottom Line
Two and a half years on, the Red Sea is not the choke-and-crisis story it was in 2024. Suez is moving traffic. Container rates have normalised to a higher-than-baseline but functional level. Insurance remains elevated but no longer drives routing decisions. Egypt’s macro accounts have stabilised. The carriers that adapted have absorbed the cost and reset their operating bases. And the investor implications have shifted from disruption-trade positioning toward normalisation-trade positioning — a less spectacular set of returns, but a more stable one.
The persistent reality is that the southern Red Sea is now a residual-risk corridor rather than a clean shipping lane. Underwriters price it that way, contract structures embed it, and carriers run sailings through it on a vessel-by-vessel risk basis rather than a default-route assumption. That residual is the cost of having learned the lesson that single-chokepoint dependence is fragile. Whether it normalises further in 2026 or proves to be the new floor depends on the political and security trajectory more than on the shipping industry itself.
For the GCC and broader Middle East, the Red Sea story is part of a wider pattern in which regional infrastructure — pipelines, ports, terminals, shipping lanes — is increasingly viewed as a strategic asset class rather than a logistics utility. The investments and policy responses through 2026 and beyond will reflect that recognition.