Dubai’s residential property market entered its first genuine soft patch since early 2021 in the first quarter of 2026. Transaction volumes fell 11 percent quarter-on-quarter. The headline price index flatlined after eleven consecutive quarters of gains. The most expensive apartment segments — Downtown, Marina, Palm Jumeirah — posted small declines. Rental yields compressed across every sub-market as rents failed to keep pace with the 2022-2024 price surge.
None of this rises to the level of crisis. Dubai transacted more apartments in Q1 2026 than in all of 2021. Villa prices in mid-tier communities continued to rise. Foreign buyer demand remained robust even as its composition shifted. Rental markets remain tight by historical standards. But the Q1 numbers mark a meaningful change in the rhythm of a market that had seemed immune to cooling for three straight years.
This article walks through what actually happened in Q1 2026, which districts are winning and losing, how the shifts align with longer-term drivers, and what buyers, sellers, and observers of the Gulf property landscape should take from the data.

The Headline Numbers
Dubai Land Department transaction data for Q1 2026 shows the clearest picture:
| Metric | Q1 2025 | Q4 2025 | Q1 2026 | YoY change |
|---|---|---|---|---|
| Total transactions | 38,420 | 41,080 | 34,180 | -11.0% |
| Off-plan transactions | 23,100 | 26,940 | 19,680 | -14.8% |
| Secondary transactions | 15,320 | 14,140 | 14,500 | -5.4% |
| Total value (AED bn) | 128.4 | 147.1 | 118.6 | -7.6% |
| Avg apartment price (AED/sqft) | 1,785 | 1,922 | 1,918 | +7.5% |
| Avg villa price (AED/sqft) | 1,910 | 2,034 | 2,061 | +7.9% |
| Gross rental yield (avg) | 6.4% | 6.0% | 5.8% | -0.6pp |
| Foreign buyer share | 71% | 73% | 72% | +1pp |
The quarter shows three distinct dynamics. First, off-plan volume correction is the dominant factor — down 15 percent YoY and nearly 27 percent versus Q4 2025. Second, ready-market transactions are decelerating more modestly, suggesting underlying buyer interest remains, just at slower pace. Third, price levels are effectively plateauing on a quarterly basis even as the year-on-year comparison still shows gains reflecting the 2024-2025 run-up.
District-Level Patterns
Dubai is not a single market. The Q1 2026 softening is highly uneven across the city, and the district-level data tells a more nuanced story.
| District | Avg price (AED/sqft) | QoQ change | YoY change | Rental yield |
|---|---|---|---|---|
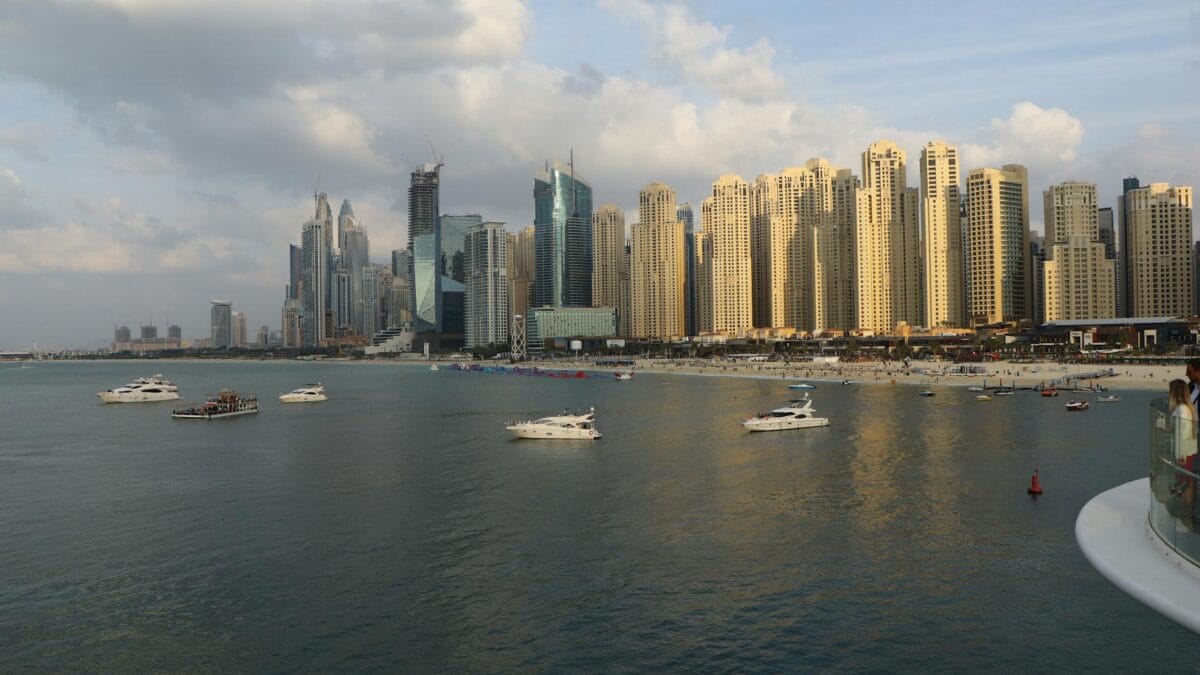
| Downtown Dubai | 3,450 | -1.8% | +5.2% | 4.6% |
| Palm Jumeirah | 4,820 | -2.1% | +3.8% | 4.8% |
| Dubai Marina | 2,285 | -1.4% | +6.5% | 5.1% |
| Business Bay | 1,870 | -0.6% | +8.1% | 5.8% |
| DIFC | 2,960 | -0.9% | +4.5% | 5.2% |
| Dubai Hills Estate | 1,580 | +1.2% | +9.4% | 6.2% |
| JVC (Jumeirah Village Circle) | 1,120 | +2.8% | +12.1% | 7.5% |
| Dubai South | 985 | +3.1% | +14.8% | 7.8% |
| Al Furjan | 1,205 | +2.1% | +11.2% | 7.1% |
| MBR City | 1,920 | +0.4% | +10.5% | 6.5% |
| Emirates Hills (villas) | 3,180 | -1.2% | +2.8% | 4.5% |
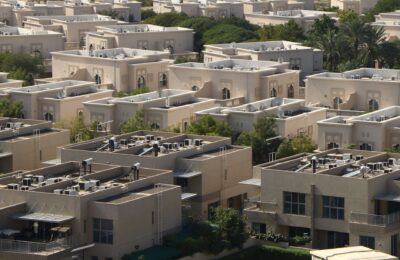
| Arabian Ranches (villas) | 1,680 | +0.8% | +9.2% | 5.8% |
The pattern divides cleanly into two groups. Established premium areas — Downtown, Palm, Marina, DIFC, Emirates Hills — are softening as the luxury-end demand that drove 2022-2024 gains normalises. Emerging communities and mid-tier areas — JVC, Dubai South, Al Furjan, MBR City, Dubai Hills — continue to post gains, often driven by infrastructure improvements (metro extensions, new schools, community amenity completion) and relatively more accessible pricing.
What Is Driving the Shift
Multiple structural and cyclical factors are contributing to the Q1 2026 pattern. Some are Dubai-specific; others reflect broader global real estate dynamics.
Interest rate environment. UAE dirham is pegged to the US dollar, so UAE Central Bank rates track Fed policy. Even as the Fed has cut from the 2024 peak of 5.5 percent to approximately 3.75 percent in April 2026, mortgage rates in Dubai remain elevated at 5.5-6.5 percent for prime borrowers. That is materially higher than the 2-3 percent rates that supported the 2021-2022 buying surge.
Normalisation of Russian demand. The Russian capital flight that drove 15-20 percent of foreign buyer volume in 2022-2023 has moderated. Remaining Russian demand is concentrated among resident-investor buyers rather than one-time capital flight. Total Russian transaction volume in Q1 2026 is down approximately 35 percent from the 2023 peak.
Oversupply concerns in premium segments. Approximately 65,000 new apartments are scheduled for handover in 2026-2027, with significant concentrations in Downtown, Business Bay, and Marina. The absorption pace for this pipeline is the single most-watched metric for 2026 market trajectory.
Comparative valuation. Dubai’s price-to-rent ratios relative to comparable global cities (London, Singapore, New York) have moved from discount to near-parity. The “cheap London flat” narrative that drove British and European buyers in 2020-2022 has weakened as absolute price levels rose.
Vision 2030 competition. Riyadh’s property market has emerged as a parallel investment destination for some Gulf and international capital, particularly as Vision 2030 progress attracts more institutional interest. This is a marginal factor but worth noting.
The Buyer Mix: Who’s In, Who’s Out
The nationality composition of Dubai property buyers has evolved materially since 2022. The current mix reflects both shifting global capital flows and Dubai’s deliberate positioning for specific investor demographics.
| Nationality | Share of foreign buyers Q1 2026 | Change vs 2023 peak |
|---|---|---|
| Indian | 22% | +2pp |
| Russian | 12% | -6pp |
| Chinese | 9% | +4pp |
| Pakistani | 8% | +1pp |
| United Kingdom | 7% | 0pp |
| European (excl. UK) | 11% | -1pp |
| Gulf regional | 9% | +2pp |
| Other | 22% | -2pp |
Indian buyers dominate foreign inflow. The combination of proximity, language, large diaspora, and Dubai’s Golden Visa programme has made UAE property a standard destination for Indian wealth outflow. Typical purchase is a $250,000 to $600,000 apartment in JVC, Dubai Hills, or Al Furjan, often with an investor focus on rental yield.
Chinese buyer presence has grown meaningfully since 2023. This partly reflects the general trend of Chinese capital seeking offshore diversification amid domestic property weakness; partly reflects specific Dubai positioning to attract Chinese investors with services targeting that market. The Q1 2026 Chinese buyer volume is 20 percent higher than Q1 2025.
Russian and European volumes have moderated. The Russian moderation reflects both sanctions compliance complexity (European-owned intermediaries declining some Russian business) and normalisation of the 2022 one-time surge. European buyer decline reflects higher domestic interest rates making cross-border property investment less attractive.
The Rental Market
Rental yields have compressed as price appreciation outpaced rental growth over the past three years. The Q1 2026 picture shows a still-tight rental market in absolute terms — occupancy rates above 90 percent in most districts — but yields that are no longer competitive with fixed-income alternatives.
Average rental growth in Q1 2026 was approximately 7.8 percent year-on-year across Dubai, versus price growth of 7.5 percent. That roughly matches price growth and stabilises the yield picture — no further compression but also no yield recovery. The absolute yield level of 5.8 percent average is below the 6.5-7.5 percent range that Dubai historically offered against other regional markets.
For landlords who own debt-free, 5.8 percent gross yield less service charges, maintenance, and management fees nets approximately 4.5-5.0 percent — still competitive with dirham-denominated bond yields and below inflation-adjusted returns in some international comparisons. For highly leveraged landlords, the math is tighter as mortgage rates have risen.
Tenant-driven demand remains healthy. Dubai’s population grew approximately 4.1 percent in 2025, driven by continued inbound relocation from India, Pakistan, the Philippines, Egypt, Russia, and Western countries. This demographic tailwind is the single most durable feature of the Dubai property thesis and the reason most analysts (and Financial Times coverage) frame the Q1 2026 shift as cyclical rather than structural.
The Metro Route 2020 Effect on Property Values
The Dubai Metro Route 2020 extension, operational since 2021, continues to reshape property value curves across districts it serves. The extension added seven stations connecting Jebel Ali, Al Furjan, Discovery Gardens, Gardens, Palm Jumeirah, and DMCC Metro to the main Dubai Metro network. Property values along the extended corridor have appreciated 18-30 percent above the Dubai-wide average since the extension opened.
Specific value deltas by station vicinity show the pattern clearly. Properties within 500 metres of the Al Furjan station have appreciated 28 percent since station opening; those within 500 metres of Discovery Gardens station have appreciated 24 percent; Palm Jumeirah station vicinity properties have appreciated 19 percent. The magnitude of metro-proximity premium has grown over time as the value of the connectivity is increasingly reflected in willingness-to-pay.
Coverage of this phenomenon by Bloomberg property analysts has identified Dubai as a leading example globally of infrastructure-value linkage in high-growth property markets. Comparable effects in Doha (Doha Metro) and Riyadh (Riyadh Metro opening 2026) provide regional context. For buyers analysing Q1 2026 opportunities, metro proximity should be a first-order decision input rather than a nice-to-have feature.
The Commercial Side: Offices in Business Bay and DIFC
Residential is the dominant segment of Dubai property but the commercial market — particularly office and retail — has its own Q1 2026 story worth examining. Grade A office rents in DIFC reached AED 285 per square foot at April 2026, up 14 percent year-on-year and among the highest in any emerging market. Business Bay grade A rents sit at AED 185 per square foot, up 11 percent. Older stock in Media City and Internet City has appreciated more modestly at 4-6 percent.
The office demand driver is the continued inflow of international corporate regional headquarters to Dubai. Since 2022, more than 200 multinationals have established or relocated regional HQs to Dubai, including Block (formerly Square), Deliveroo regional ops, Revolut Middle East, and numerous Saudi and Indian corporations expanding regional presence. The Emirates Golden Residency programme for company founders supports this trend. The result is tight supply in grade A office stock and rental growth that has outpaced residential.
Retail property has been more segmented. Prime retail at Dubai Mall, Mall of the Emirates, and high-street Downtown Dubai locations has seen rents recover to and exceed 2019 levels. Mid-tier retail in community malls has been flat. Strip retail in secondary locations remains soft as e-commerce penetration continues.
Golden Visa and Long-Stay Buyers
The UAE Golden Visa programme has been a key driver of the 2022-2025 property rally and remains an important structural factor in Q1 2026 buyer composition. Approximately 40 percent of foreign Dubai property buyers are directly or indirectly linked to the Golden Visa eligibility threshold (AED 2 million property value for individual residency).
The demographic pattern of Golden Visa-linked buyers differs meaningfully from pure investor buyers. Golden Visa buyers are typically primary-home users rather than pure investors, have longer holding horizons (5+ years versus 2-3 for flippers), and contribute to the demographic stability of residential communities. The 2022-2024 expansion of Golden Visa categories to include skilled professionals, entrepreneurs, and high achievers in various fields has substantially expanded the eligible buyer pool.
Specific categories driving Q1 2026 Golden Visa activity include: medical professionals (doctors, specialists) relocating from Europe and India; engineering professionals from Russia, Iran, and broader emerging markets; entrepreneurs using the UAE Entrepreneur Residency; and skilled professionals qualifying via salary thresholds. Each category has slightly different property preferences that show up in district-level demand patterns.
Developer League Table: Who’s Who in 2026
Dubai has consolidated developer concentration over the past decade. The top-5 developers now account for approximately 65 percent of new-launch volume:
| Developer | 2025 launches | 2026 Q1 launches | Strategic focus |
|---|---|---|---|
| Emaar Properties | 38 | 8 | Premium and master-planned communities |
| Damac Properties | 47 | 9 | Mid-market branded residences and luxury |
| Sobha Realty | 24 | 5 | Mid-luxury apartments and villas |
| Meraas (Dubai Holding) | 18 | 3 | Waterfront and distinctive master-planned |
| Nakheel | 12 | 2 | Waterfront, Palm Jebel Ali reactivation |
| Aldar (Dubai expansion) | 8 | 2 | Integrated mixed-use developments |
| Azizi Developments | 15 | 2 | Mid-market urban living |
| Omniyat | 6 | 0 | Ultra-luxury hotel-branded residences |
Emaar remains the market leader in perceived quality and has the most conservative launch pace relative to its balance sheet. Damac has the largest 2025 launch book but also the most aggressive sales-price-to-cost ratios. Sobha has grown steadily with a reputation for build quality. Aldar’s post-2023 Dubai expansion through acquisitions of smaller developers and land positions represents Abu Dhabi capital moving into Dubai — a strategic development worth monitoring over 2026-2027.
Mortgage Market Dynamics
The Dubai mortgage market has expanded significantly over the past decade but remains smaller as a share of total transactions than in comparable developed markets. Approximately 45 percent of Q1 2026 transactions involved mortgage financing, up from 30 percent in 2019 but well below the 70-80 percent typical of US or UK markets. Cash buyers continue to dominate the market, particularly at the luxury end and among foreign buyers.
Mortgage rates in Dubai have tracked the Fed cutting cycle with some lag. Prime borrower rates at UAE banks in April 2026 range from 5.5 to 6.5 percent for standard 25-year mortgages on resident buyers; slightly higher for non-resident buyers. Fixed-rate products dominate the market versus variable-rate products, reflecting UAE central bank preferences. Maximum loan-to-value ratios are 80 percent for UAE nationals, 75 percent for residents, and 60-65 percent for non-residents — limits that have moderated the leverage cycles compared to pre-2008 markets.
Mortgage stress metrics are benign. Non-performing mortgage loans at UAE banks stood at 1.2 percent in Q1 2026, well below historical averages and materially below levels in most developed markets. Early-warning indicators (30-day delinquency, mortgage servicing cost ratios) are all within normal ranges. The prudential regulation by the UAE Central Bank since 2013 has produced a structurally more conservative mortgage market than existed before the 2008 crisis.
Secondary Market Dynamics and Time-on-Market
The Dubai secondary (ready) property market shows specific patterns worth examining. Time-on-market for listed ready apartments averaged 38 days in Q1 2026, up from 28 days in Q1 2025 but well below the 75-day average of 2020. For villas, time-on-market averaged 52 days, up from 41 days year-on-year. These lengthening but still-healthy metrics confirm the market transition from overheated to normal without breaking into distressed.
Price negotiation between list and sale prices has returned as a meaningful market feature. Q1 2026 secondary market transactions closed at an average 3.2 percent discount to initial listing price, versus 1.1 percent discount in Q1 2025. Luxury segments show wider discount rates (4-6 percent) than mid-tier (2-3 percent). The discount return is a clean quantitative indicator of the shift from seller’s to buyer’s market dynamics.
Regulatory and Legal Updates 2025-2026
Several regulatory updates during 2025-2026 have affected property market dynamics. The Dubai Land Department introduced a mandatory e-registration system for all off-plan sales in March 2025, improving transparency and fraud protection. The January 2026 amendments to the Real Estate Regulatory Agency guidelines introduced stricter escrow requirements for project funds and increased developer disclosure requirements.
The 9 percent Corporate Tax introduced in 2023 continues to have limited impact on residential property transactions for individual buyers but has affected institutional investors’ structuring. Free zone entities remain preferential tax structures for larger institutional property ownership. No capital gains tax on property has been introduced, maintaining Dubai’s competitive position relative to London (which taxes foreign property investors increasingly aggressively) and other global markets.
Specific recent updates include: tightened anti-money-laundering rules for cash property transactions above AED 1 million; enhanced foreign beneficial ownership reporting requirements; and a new framework for branded residences that standardises disclosure obligations for developers selling under luxury hotel brands.
Regional Context: Riyadh, Doha, and Abu Dhabi
Dubai’s property market operates in competition with and alongside other Gulf property centres. Understanding the regional comparative position informs Dubai-specific analysis.
Riyadh. The Saudi capital’s property market is in structural growth phase driven by Vision 2030 mega-projects, Saudization relocations, and Saudi Central Bank mortgage market development. Average Riyadh residential prices have appreciated 45-60 percent since 2020 but remain approximately 40 percent below Dubai on a per-square-foot basis in comparable districts. Riyadh is the highest-growth regional property market but with different structural characteristics — lower foreign buyer share, higher owner-occupier share, shorter trading history.
Doha. Qatar’s property market is more stable and smaller in absolute scale. Pre-World Cup 2022 infrastructure build-out created substantial new inventory that has been absorbing through 2024-2026. Residential prices in Doha have been relatively flat since 2023. Qatar’s overall demographic growth is slower than Dubai’s, limiting cyclical upside but also limiting downside.
Abu Dhabi. The emirate’s property market has structurally different characteristics from Dubai. Abu Dhabi government employment provides more demand stability; the sovereign wealth fund (Mubadala, ADQ) is more directly involved in property development; expats represent a smaller share of buyers. Abu Dhabi residential prices have appreciated 12-18 percent since 2020, versus Dubai’s 40+ percent, reflecting the different underlying demand drivers. Aldar’s Dubai expansion is partly a response to these differentials.
The Tourism Component
Dubai tourism volumes directly affect a specific property segment: short-term-rental properties (STR), hotels, and branded residences with holiday-let components. Dubai welcomed 18.7 million international overnight visitors in 2025, a record, and the Q1 2026 pace is running 4 percent ahead of Q1 2025. Hotel occupancy rates average 83 percent in Q1 2026 versus 81 percent Q1 2025.
This tourism tailwind supports specific property types. Studio and one-bedroom units in Downtown, Marina, JBR, and Business Bay that cater to short-term vacation renters have benefitted from sustained high occupancy. Platforms like Airbnb and Bayut’s short-term rental subsidiary have seen strong growth in Dubai listings. The short-term rental yield premium over standard long-term rental remains approximately 30-50 percent for well-managed properties in prime tourist districts.
The relationship between hotel supply growth and residential supply matters for the overall market balance. Dubai hotel keys grew approximately 7 percent in 2025, pressure releasing some short-term-rental demand back into the hotel system. For 2026-2027, new hotel openings in Expo City, Downtown, and the Palm will provide additional pressure valve — good news for residential pricing stability.
Developer Response
Major developers have responded to the Q1 2026 softening with a mix of launch deceleration, increased incentives, and selective repositioning. Emaar launched 8 projects in Q1 2026 versus 11 in Q1 2025. Damac launched 9 versus 13. Sobha launched 5 versus 6. Meraas and Nakheel held roughly steady at lower overall launch count.
Payment-plan incentives have expanded materially. Standard 40/60 payment plans (40 percent during construction, 60 percent at handover) have increasingly shifted to 30/70 or even 20/80 structures. Post-handover payment plans extending 5-7 years beyond handover are now common across mid-market offerings. Free service charges for 2-3 years have become a standard incentive for mid-tier off-plan launches.
Developer balance sheets are healthier than in 2008. Emaar carries net cash. Damac balance sheet leverage is moderate. Sobha is family-owned with conservative financial structure. This balance-sheet position means developers can afford to moderate launches and hold pricing rather than being forced into distressed sales. The 2008-2010 Dubai real estate crash was largely driven by developer financial distress and debt-funded speculation; neither is currently present.
Institutional investors have stepped in opportunistically. Aldar (the Abu Dhabi-listed developer) has expanded Dubai presence through land acquisitions and project partnerships. Private equity vehicles from global firms including Brookfield, Hines, and Tishman Speyer are evaluating portfolio acquisitions, particularly in income-generating retail and office assets in mature districts.
Comparison with Previous Cycles
Dubai has seen three previous cycles of significant real estate correction: 2008-2010 (global financial crisis), 2015-2017 (oil-price shock), and 2020 (pandemic). Comparing current conditions to each provides useful context.
| Indicator | Q1 2008 peak | Q1 2015 peak | Q1 2020 peak | Q1 2026 |
|---|---|---|---|---|
| Developer leverage | Very high | Moderate | Moderate | Low |
| Off-plan share | 75% | 55% | 40% | 58% |
| Buyer leverage (avg LTV) | 85% | 70% | 65% | 55% |
| Price volatility | Extreme | Moderate | Limited | Low (so far) |
| Rental market | Oversupplied | Balanced | Weakening | Tight |
| Population growth | +8% (peak) | +3.5% | -2% | +4.1% |
The 2008 analogue is particularly inapt. That cycle was driven by developer over-leverage, flipping speculators with 90 percent+ LTV, a concentrated buyer base of foreign flippers, and a global liquidity crisis that removed financing overnight. None of those conditions prevail in 2026.
The 2015 analogue is closer. That correction was driven by oil-price weakness reducing regional business activity and Russian sanctions reducing one buyer pool; it played out over two years with aggregate price declines of approximately 20-25 percent before stabilising. If the 2026 cycle followed a similar pattern, prices could soften 10-15 percent from current levels before stabilising, with mid-tier and emerging areas holding better than established premium districts.
Outlook for 2026-2027
The base case for the rest of 2026 is continued modest softening in premium districts, continued modest gains in mid-tier emerging areas, and overall market stability rather than significant dislocation. Several factors support this view:
- UAE macroeconomy remains robust — GDP growth estimated at 4.1 percent in 2026
- Population inflow continues at historically high rates
- Expo legacy infrastructure and metro expansion support connectivity
- Developer balance sheets are healthy, limiting distress-driven supply
- Competing global real estate markets (London, Singapore) offer less attractive entry points
- UAE’s Golden Visa programme and business-friendly regulations continue attracting migrants
Downside risks exist. A sharper-than-expected oil-price decline affecting regional employment could reduce inbound relocation. A global risk-off event could trigger redemptions in international investor-owned assets. Specific oversupply in the luxury apartment segment could pressure prices further. None of these are central base cases but should be monitored.
Upside scenarios include a Fed cutting cycle accelerating beyond current expectations (supporting mortgage demand), a resolution of regional geopolitical tensions attracting renewed international capital, and acceleration of Saudi-side mega-project activity creating regional investment halo that benefits Dubai as well.
What Buyers Should Do
The Q1 2026 market offers specific opportunities for different buyer types:
For end-users seeking primary residence. The market has moved from seller’s to buyer’s territory. Negotiation leverage has returned, particularly in premium secondary market. Quality apartments in Downtown, Marina, and Palm can often be bought 3-5 percent below asking. Motivated sellers exist in cases of relocation or portfolio rotation.
For yield-focused investors. Mid-tier districts offering 7+ percent yields (JVC, Al Furjan, Dubai South) remain the strongest case. Newer off-plan launches with long payment plans and guaranteed-rent programmes can pencil attractively for financial buyers. Watch service charge escalation carefully — it is the factor that erodes net yield most in year three onwards.
For off-plan speculators. The 2022-2024 approach of buying off-plan for resale at handover has substantially less upside in the current cycle. Flipping profits on mid-tier off-plan launches are compressing. Off-plan flipping still works in specific hot districts but carries materially more risk than 18 months ago.
For luxury buyers. Premium villa market in Dubai Hills, Emirates Hills, and Meydan remains attractive. Luxury apartment segment (Palm, Downtown, Marina) has more relative softening and should be pursued with patience. Off-plan luxury launches with strong developer track records (Omniyat, Dorchester Collection) remain commercially interesting.
A final note on tangential property-market influences in 2026: the UAE’s continued positioning as a neutral regional hub for international business continues to benefit residential demand through 2026-2027. The normalisation of Saudi-Iranian relations since 2023, the ongoing stabilisation of the Turkish economy (see our recent analysis of the Turkish Lira trajectory), and the resumption of Gulf-wide tourism flows have all contributed to a resilient Dubai investment thesis. Competing factors include selective slowdowns in Chinese property-driven capital outflows and European high-net-worth individuals repositioning portfolios amid their own domestic regulatory pressures.
The Bottom Line
Dubai’s Q1 2026 softening is real, measurable, and meaningful — but it is not a crisis. Transaction volumes remain high by any historical standard. Prices are roughly flat rather than falling sharply. Rental demand is robust. Developer financial health is strong. The fundamentals that drove the 2022-2024 rally — demographic growth, regional capital flow, lifestyle attractiveness — remain in place.
The more accurate framing is normalisation. The 2022-2024 price surge was driven by several one-time factors (Russian capital flight, post-pandemic demographic catch-up, exceptional global liquidity) that have moderated. What remains is a structurally attractive market at a cyclical resting point. Buyers entering now rather than in early 2024 will pay more in absolute terms but receive better negotiation leverage and more realistic developer positioning.
For observers of Gulf property markets more broadly, Dubai’s Q1 shift is worth watching. Riyadh’s property market continues to grow driven by Vision 2030; Doha’s is more stable and smaller; Abu Dhabi’s is structurally distinct. Dubai’s pattern often leads the region, and the current softening may presage cyclical moderation in adjacent Gulf cities over 2026-2027. The specific mix of healthy buyer demand, stable developer structure, and moderated price momentum suggests the Dubai market is positioned to consolidate current levels rather than break down — the preferred trajectory for long-term owners and institutional investors, even if less exciting for trading speculators.