الفارق الذي لا ينبغي أن ينعكس أبداً
في سوق النفط العالمي، تُعامل علاقات سعرية معينة كثوابت شبه دائمة – سمات هيكلية للسوق موثوقة لدرجة أن استراتيجيات تداول بأكملها تُبنى على استمرارها. فارق WTI-Brent واحد منها. خام غرب تكساس الوسيط، معيار أمريكا الحبيس المسعّر في كوشينغ، أوكلاهوما، يتداول أقل من برنت، المعيار الدولي البحري، دائماً تقريباً. يتراوح الخصم عادة بين 2-5 دولارات للبرميل، مما يعكس عيب النقل لـ WTI: يجب ضخه عبر أنابيب أو نقله بالسكك الحديدية إلى المصافي الساحلية ومحطات التصدير، بينما يُسعّر برنت عند حافة الماء. في 28 مارس 2026، انعكس هذا الفارق. أغلق WTI عند 111.47 دولاراً بينما استقر برنت عند 110.83 دولاراً. كانت العلاوة صغيرة، 64 سنتاً فقط، واستمرت جلستي تداول فقط قبل أن تنعكس. لكن في عالم تداول النفط، تحدثت تلك الـ 64 سنتاً بصوت أعلى من أي تقرير محلل أو بيان حكومي. قالت: شيء ما مكسور جوهرياً.
لفهم لماذا يهم انعكاس مؤقت بـ 64 سنتاً في فارق أسعار مستقر عادة، تحتاج لفهم ما يمثله هذا الفارق، وما القوى التي يمكنها تشويهه، وما يخبرنا به التشويه عن حالة أسواق الطاقة العالمية في أبريل 2026. هذا ليس مجرد فضول تقني للمتداولين. علاقة WTI-Brent هي مقياس لوظيفة سوق النفط العالمي، وانعكاسها يشير إلى مستوى من الإجهاد والاختلال له تداعيات عميقة على أسعار الطاقة والاستقرار الاقتصادي واستراتيجية الاستثمار عالمياً.
فهم علاقة WTI-Brent
الحالة الطبيعية
منذ ظهور WTI وBrent كمعياري النفط الخام المهيمنين في العالم في الثمانينيات، اتبعت علاقتهما السعرية نمطاً متوقعاً تشكله الأساسيات المادية للسوق.

مزايا برنت: يُسعّر خام برنت على أساس FOB (تسليم على ظهر السفينة) في محطات بحر الشمال. وهو المعيار لما يقرب من 60% من النفط الخام المتداول عالمياً. طبيعته البحرية تعني أنه يمكن تحميله على ناقلات وشحنه إلى أي مكان في العالم، مما يمنحه أقصى درجات المرونة ويجعله استجابة لديناميكيات العرض والطلب العالمية. يتضمن تسعير برنت أيضاً سلة أوسع من خامات بحر الشمال (برنت، فورتيز، أوسبيرغ، إيكوفيسك، وترول – سلة “BFOET”)، مما يجعله أكثر تمثيلاً لظروف السوق الدولية.
عيوب WTI: يُسعّر WTI عند نقطة تسليم كوشينغ، أوكلاهوما، وهو مركز حبيس متصل بأحواض الإنتاج (البيرميان، باكن، وغيرها) والمصافي (ساحل الخليج، الغرب الأوسط) عبر خطوط الأنابيب. بينما جعلت ثورة النفط الصخري الولايات المتحدة أكبر منتج للنفط الخام في العالم، يظل تسعير WTI مقيداً بسعة خطوط الأنابيب وديناميكيات التخزين في كوشينغ ولوجستيات نقل الخام إلى محطات التصدير على ساحل الخليج. هذا العيب الهيكلي يبقي عادة WTI أقل بـ 2-5 دولارات من برنت.
الانعكاسات التاريخية
انعكس فارق WTI-Brent (WTI أعلى من برنت) في حفنة من المناسبات فقط، كل منها مدفوع بظروف غير عادية:
- الأزمة المالية 2008: انعكاسات موجزة مع انهيار كلا المعيارين من 147 إلى 33 دولاراً، مع خلق آليات تسوية مختلفة اختلالات مؤقتة
- الربيع العربي 2011: الانعكاس الأبرز سابقاً، لكنه نجم عن تخمة تخزين في كوشينغ ضغطت على WTI بشكل مصطنع، وليس عن قوة WTI. ارتفع برنت فعلياً بينما انخفض WTI، موسعاً الفارق إلى خصم غير مسبوق بـ 28 دولاراً لـ WTI قبل التطبيع في النهاية
- انهيار كوفيد 2020: أصبح WTI سلبياً لفترة وجيزة (37.63- دولار) في أبريل 2020 مع امتلاء مخازن كوشينغ، لكن هذا كان حدث انتهاء صلاحية ليوم واحد لعقد مايو، وليس انعكاساً هيكلياً حقيقياً
انعكاس مارس 2026 مختلف عن كل هذه. إنه مدفوع ليس بضعف WTI أو عوامل تقنية، بل بقوة WTI الحقيقية مقارنة ببرنت – إشارة إلى أن السوق المحلي الأمريكي يسعّر قلق عرض يتجاوز حتى الاضطراب الضخم لتدفقات النفط الخام البحرية الدولية. هذا، بالمصطلح التقني، غير عادي للغاية.
ما سبب الانعكاس
العامل الأول: جانب برنت – مفارقة اضطراب العرض
يقترح المنطق أن حرباً في الخليج العربي يجب أن تدفع برنت أعلى من WTI، لأن برنت هو المعيار الدولي الأكثر تأثراً مباشرة باضطرابات العرض الخليجية. وبالفعل، ارتفع برنت بشكل حاد من 78 دولاراً قبل الصراع إلى أكثر من 110 دولارات في أوائل أبريل. لكن عدة عوامل حدت من ارتفاع برنت مقارنة بـ WTI:
إلغاء الشحنات والقوة القاهرة في العقود: أعلن المنتجون الخليجيون القوة القاهرة على عقود تصدير عديدة، مما أزال فعلياً براميل من السوق. عندما لا يمكن تحميل البراميل على الناقلات، لا يمكن تسعيرها. هذا يخلق وضعاً متناقضاً حيث النقص المادي شديد لدرجة أنه يزيل نفسه جزئياً من آلية التسعير. برنت، الذي يعكس النفط الخام البحري المتداول، لا يستطيع تسعير البراميل التي لا يتم تداولها بالكامل.
تجنب الشحن: الناقلات التي تتجنب الخليج العربي والبحر الأحمر تعني عدداً أقل من شحنات برنت الفعلية المتداولة. تخفيض نشاط السوق المادي يخلق سوقاً أرق حيث يصبح اكتشاف السعر أقل كفاءة. يفيد بعض المتداولين أن فروق العرض والطلب لشحنات برنت المادية اتسعت من المعتاد 0.05-0.10 دولار للبرميل إلى 1-3 دولارات، وهي علامة على سيولة متضررة بشدة.
منافسة الخام البديل: مع اختفاء البراميل الخليجية من الأسواق الدولية، يتنافس المشترون على إمدادات بديلة: خام غرب أفريقيا وأمريكا اللاتينية وبحر قزوين وروسيا. تُسعّر هذه الخامات بفروقات متفاوتة عن برنت، والمنافسة الشديدة تخلق ديناميكيات قيمة نسبية معقدة لا تترجم بنظافة إلى قوة معيار برنت.
العامل الثاني: جانب WTI – قلق العرض الأمريكي
المحرك الأكثر إثارة للدهشة للانعكاس هو على جانب WTI: طلب شديد على النفط الأمريكي دفع WTI فوق خصمه المعتاد عن برنت.
طفرة طلب المصافي الأمريكية: تعمل المصافي الأمريكية بنسبة 93% من الاستخدام (قريبة من أعلى المستويات على الإطلاق)، مستهلكة أحجاماً قياسية من الخام. تتصارع مصافي ساحل الخليج التي كانت تعالج سابقاً خامات مستوردة متوسطة وثقيلة حامضة من الخليج لاستبدال الواردات المفقودة بخام محلي خفيف حلو، مما يرفع أسعار WTI في كوشينغ ونقاط تسليم ساحل الخليج.
انفجار الطلب على التصدير: ارتفعت صادرات النفط الخام الأمريكية إلى مستويات قياسية مع إعادة توجيه المشترين الدوليين، غير القادرين على الحصول على براميل خليجية، مشترياتهم إلى المنتجين الأمريكيين. تعمل محطات التصدير في كوربس كريستي وهيوستن ولويزيانا بأقصى طاقتها، مع تمديد طوابير السفن إلى 10-14 يوماً مقارنة بالانتظار المعتاد 2-3 أيام. هذا السحب التصديري يستنزف مخزون كوشينغ ويرفع سعر WTI.
سحب مخزون كوشينغ: انخفضت المخزونات التجارية من النفط الخام في مركز كوشينغ من 35 مليون برميل قبل الصراع إلى حوالي 22 مليون برميل، مقتربة من الحدود التشغيلية الدنيا. عندما تنخفض مخزونات كوشينغ إلى أقل من حوالي 20 مليون برميل، تتعرض آلية التسليم المادي لعقود WTI الآجلة للضغط، مما يخلق ضغطاً صعودياً على الأسعار مستقلاً عن أساسيات العرض والطلب العالمية.
سياسات الاحتياطي الاستراتيجي: يوفر الاحتياطي البترولي الاستراتيجي الأمريكي، بحوالي 400 مليون برميل، حاجزاً نظرياً. ومع ذلك، تحجم الإدارة عن تفويض إطلاقات كبيرة، بعد أن سحبت بالفعل من الاحتياطي بشكل كبير في 2022-2023. الحساب السياسي لمزيد من استنزاف احتياطي الطوارئ الوطني أثناء صراع عسكري نشط محفوف بالمخاطر، ويرى السوق أن الإغاثة المحدودة من الاحتياطي مستبعدة.
العامل الثالث: هيكل السوق – منحنى العقود الآجلة يروي القصة
يوفر منحنى العقود الآجلة – رسم بياني للأسعار للتسليم في تواريخ متتالية أبعد – رؤية إضافية لنفسية السوق.
تخلف حاد: منحنيات العقود الآجلة لكل من WTI وBrent في تخلف حاد، مما يعني أن عقود الشهر القريب تتداول بعلاوات كبيرة على الأشهر اللاحقة. وصل فارق WTI بين الشهر الأمامي و12 شهراً إلى 18 دولاراً للبرميل في أواخر مارس، وهو مستوى يتجاوز حتى ذروتي 2008 و2022. يخبرنا هذا الهيكل أن السوق يسعّر أزمة عرض حادة قريبة المدى مع بعض التوقع بالتطبيع بمرور الوقت.
لكن هيكل التخلف يختلف بين المعيارين. تخلف برنت أكثر حدة في الأشهر الأمامية لكنه يتسطح أسرع، مما يشير إلى أن السوق يتوقع تطبيعاً جزئياً للعرض الدولي خلال 6-9 أشهر مع تصاعد المصادر البديلة واستعادة بعض الإنتاج الخليجي. تخلف WTI أكثر استمراراً عبر المنحنى، مما يشير إلى أن السوق يرى ضيق العرض المحلي الأمريكي كمشكلة أطول مدة مدفوعة بعوامل هيكلية (سعة خطوط الأنابيب، طلب المصافي، لوجستيات التصدير) بدلاً من صدمة مؤقتة.
انحراف سوق الخيارات: يروي سوق الخيارات قصة أكثر إثارة للقلق. وصل انحراف خيارات الشراء (العلاوة لحماية الصعود مقارنة بالهبوط) لـ WTI إلى مستويات لم تُشهد منذ الدورة الفائقة لعام 2008. التقلب الضمني لخيارات الشراء خارج النقد يتجاوز خيارات البيع بـ 15-20 نقطة، مما يشير إلى أن المشاركين في السوق يدفعون علاوات استثنائية للحماية ضد مزيد من ارتفاعات الأسعار. بعض المتداولين يشترون خيارات شراء عند 150 وحتى 200 دولار – علامة على أن المخاطر الطرفية للأسعار المتطرفة تؤخذ على محمل الجد.
الصورة الفنية: قراءة الرسوم البيانية
التحليل الفني لـ WTI
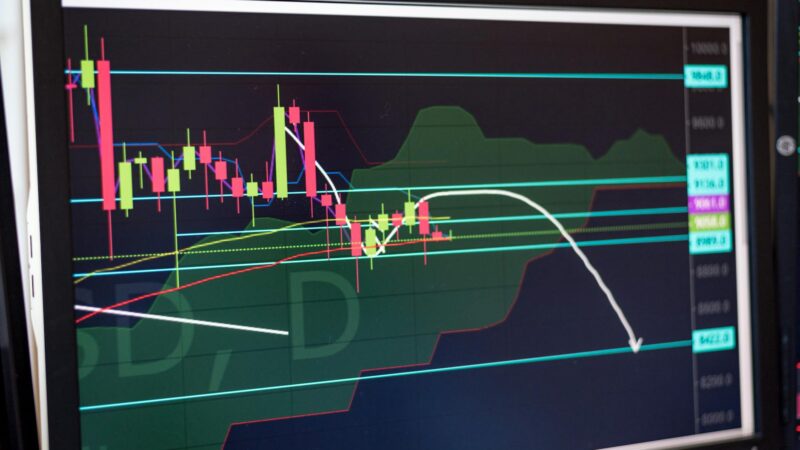
من منظور فني بحت، يقدم رسم WTI البياني منذ بداية الصراع نمط صدمة عرض كلاسيكياً مع عدة سمات ملحوظة:
الفجوة: قفز WTI بـ 8 دولارات في 3 مارس (أول يوم تداول بعد بداية الصراع في عطلة نهاية الأسبوع)، مفتتحاً عند 86 دولاراً مقابل إغلاق سابق عند 78 دولاراً. لم تُملأ هذه الفجوة وتمثل نقطة كسر هيكلية. تقليد التحليل الفني يقول إن الفجوات غير المملوءة تجذب السعر في النهاية لملئها، لكن فجوات صدمة العرض في السلع تبقى مفتوحة كثيراً لأشهر أو سنوات.
القناة: منذ الارتفاع الأولي، تداول WTI في قناة صاعدة بين حوالي 100 و115 دولاراً، مع قمم أعلى وقيعان أعلى. ميل القناة، حوالي 3 دولارات أسبوعياً، يشير إلى استمرار تضييق العرض. كسر فوق القناة عند 115 سيشير إلى تسارع نحو 125-130. كسر أدنى 100 سيشير إلى أن تطبيع العرض أو تدمير الطلب يسيطر أخيراً.
تحليل الحجم: كانت أحجام التداول أعلى بـ 60-80% من المستويات العادية، مع حجم ثقيل بشكل خاص في أيام الصعود. يؤكد نمط الحجم هذا اهتماماً حقيقياً بالشراء بدلاً من تغطية مراكز بيع أو تموضع تقني. تُظهر بيانات مجموعة CME أن الفائدة المفتوحة في عقود WTI الآجلة عند أعلى مستوياتها على الإطلاق، مما يشير إلى دخول رأس مال جديد لسوق النفط بدلاً من تدوير المراكز الحالية.
مؤشر القوة النسبية والزخم: كان مؤشر القوة النسبية لـ 14 يوماً لـ WTI فوق 70 (منطقة ذروة الشراء) لـ 18 يوم تداول متتالياً، أطول سلسلة منذ الدورة الفائقة للنفط عام 2008. ومع ذلك، يمكن لقراءات ذروة الشراء في أسواق السلع المضطربة بالعرض أن تستمر لفترات ممتدة، واستخدام مؤشر القوة النسبية كإشارة بيع عكسية أثناء أزمة عرض حقيقية كان تاريخياً استراتيجية خاسرة.
رسم فارق Brent-WTI البياني
ربما يكون رسم الفارق نفسه المؤشر الفني الأكثر دلالة. ضُغط خصم WTI المعتاد بـ 2-5 دولارات بثبات منذ بداية الصراع، مروراً بالصفر إلى الانعكاس في 28 مارس. يشبه سلوك الفارق زنبركاً ملفوفاً: فترات ممتدة من الضغط التدريجي تليها تحركات حادة. قد يكون الانعكاس، رغم قصره، الأول من عدة انعكاسات إذا لم تتغير ديناميكيات العرض الأساسية.
بشكل حاسم، يرتبط سلوك الفارق ارتباطاً قوياً بمستويات مخزون كوشينغ. يُظهر تحليل الانحدار التاريخي تغيراً بحوالي 0.50 دولار في الفارق لكل تغير بمقدار مليون برميل في مخزونات كوشينغ. مع سحب كوشينغ بحوالي 2 مليون برميل أسبوعياً، يشير المسار الرياضي إلى علاوات WTI مستمرة إذا لم يُعكس معدل السحب.
ما يشير إليه الانعكاس للأسواق العالمية
الإشارة 1: السوق المادي مكسور
الإشارة الأكثر جوهرية لانعكاس WTI-Brent هي أن آليات المراجحة الطبيعية لسوق النفط المادي العالمي لا تعمل. في سوق صحي، سيتم مراجحة أي انحراف عن الفارق الطبيعي بسرعة: سيشتري المتداولون المعيار الرخيص ويبيعون الغالي، مع شحن براميل مادية لاستعادة التوازن. استمرار وتكرار الانعكاس يخبرنا أن المراجحة المادية معطلة، على الأرجح لأن لوجستيات نقل النفط عالمياً مضطربة لدرجة أن تدفقات التجارة العادية لا تستطيع تعادل الاختلالات الإقليمية.
الإشارة 2: استقلال الطاقة الأمريكي له حدود
أصبحت الولايات المتحدة أكبر منتج للنفط الخام في العالم عام 2018 وحافظت على هذا الموقع. كانت رواية “استقلال الطاقة الأمريكي” نقطة حديث سياسية لسنوات. يكشف ارتفاع WTI حدود تلك الرواية. رغم الإنتاج القياسي، فإن السوق الأمريكي متوازن بإحكام لدرجة أن فقدان الواردات الخليجية وطفرة الطلب على التصدير يمكن أن يدفعا الأسعار المحلية فوق المعايير الدولية. استقلال الطاقة من حيث الإنتاج لا يساوي استقلال الطاقة من حيث التسعير، طالما الولايات المتحدة متصلة بالأسواق العالمية.
الإشارة 3: تدمير الطلب يقترب
عند 111 دولاراً للبرميل، تدخل أسعار النفط المنطقة حيث يصبح تدمير الطلب قوة اقتصادية كلية مهمة. يقدر صندوق النقد الدولي أن كل زيادة بمقدار 10 دولارات للبرميل في أسعار النفط تستمر لسنة واحدة تخفض الناتج المحلي الإجمالي العالمي بحوالي 0.2-0.3%. عند 111 دولاراً، يترجم هذا إلى زيادة بأكثر من 30 دولاراً عن مستويات ما قبل الصراع، مما يعني عبئاً بنسبة 0.6-0.9% على النمو العالمي – أكثر من كافٍ لدفع عدة اقتصادات من نمو بطيء إلى ركود صريح.
تعمل آلية تدمير الطلب عبر قنوات متعددة:
- إنفاق المستهلك: ارتفاع أسعار البنزين ووقود التدفئة يقلل الدخل المتاح، خاصة للأسر ذات الدخل المنخفض. ينفق المستهلكون الأمريكيون حوالي 300 دولار شهرياً أكثر على الوقود مقارنة بما قبل الصراع، ما يعادل زيادة ضريبية كبيرة.
- تكاليف النقل: زيادة أسعار الديزل بأكثر من 40% منذ بداية الصراع ترفع تكاليف النقل بالشاحنات والشحن والسكك الحديدية والشحن الجوي، مما يتغلغل في أسعار جميع السلع تقريباً.
- الإنتاج الصناعي: تواجه الصناعات كثيفة الطاقة (الكيماويات، الأسمنت، الصلب، التصنيع) ضغطاً على الهوامش يؤدي إلى تقليص الإنتاج وتسريح العمال.
- استجابة البنوك المركزية: التضخم المدفوع بالنفط يعقد السياسة النقدية. تواجه البنوك المركزية المعضلة الكلاسيكية للركود التضخمي: التشديد لمحاربة التضخم يخاطر بتعميق الركود، بينما التيسير لدعم النمو يخاطر بترسيخ توقعات التضخم.
الإشارة 4: المشاركون في السوق يتحوطون ضد المخاطر الطرفية
نشاط سوق الخيارات الموصوف أعلاه، مع شراء المتداولين خيارات شراء بأكثر من 150 دولاراً، يشير إلى أن المشاركين المحترفين في السوق يتحوطون بنشاط ضد سيناريوهات أسعار متطرفة. هذه ليست نشوة مضاربة؛ إنها إدارة مخاطر من مؤسسات لا تستطيع تحمل أن تكون بلا تحوط إذا أُغلق مضيق هرمز فعلياً أو تصاعد الصراع ليشمل منتجين إضافيين.
تشمل سيناريوهات المخاطر الطرفية التي يتم التحوط ضدها:
- إغلاق كامل لمضيق هرمز (إزالة ~17 مليون برميل يومياً من التجارة البحرية): تأثير تقديري على WTI بـ 150-200 دولار
- توسع الأعمال العدائية لتشمل منشآت الإنتاج السعودية مباشرة (إزالة 5-10 ملايين برميل يومياً): تأثير تقديري على WTI بـ 130-160 دولاراً
- أضرار مصافي متتالية تقلل طاقة المعالجة العالمية بأكثر من 10%: تأثير تقديري على سعر المنتجات المكررة يتجاوز ما يعادل 6 دولارات/غالون بنزين
التداعيات حسب قطاع السوق
أسواق الأسهم
التأثير على أسواق الأسهم منقسم بشكل حاد:
الفائزون في قطاع الطاقة: تشهد شركات الاستكشاف والإنتاج الأمريكية مكاسب أرباح استثنائية. شركات مثل إكسون موبيل وشيفرون وكونوكو فيليبس وبايونير ناتشورال ريسورسز تولد تدفقات نقدية حرة بمعدلات تتجاوز حتى مكاسب 2022. أسهم التكرير (فاليرو، ماراثون بتروليوم، PBF إنيرجي، فيليبس 66) هي المستفيد الأكبر على الإطلاق، حيث يعني انفجار هامش التكرير أنها تحقق هوامش قياسية على كل برميل تتم معالجته.
الخاسرون: شركات الطيران وشركات الشحن (رغم الأسعار الأعلى، ترتفع تكاليف الوقود أسرع) وتجارة التجزئة الاستهلاكية الاختيارية وأي شركة ذات تكاليف مدخلات طاقة كبيرة تواجه ضغطاً شديداً على الهوامش.
أسهم الأسواق الناشئة: تواجه أسهم الأسواق الناشئة المستوردة للنفط ضربة مزدوجة من تكاليف مدخلات أعلى وانخفاض العملة مع تعزز الدولار بتدفقات الملاذ الآمن. انخفضت أسواق الأسهم التركية والهندية وجنوب أفريقيا والمصرية بنسبة 15-25% منذ بداية الصراع.
الدخل الثابت
تداعيات سوق السندات معقدة:
سندات الخزانة الأمريكية: محصورة بين طلب الملاذ الآمن (إيجابي للسندات) ومخاوف التضخم من ارتفاع أسعار النفط (سلبي للسندات). تسطح منحنى العائد بشكل كبير، مع ضغط فارق السنتين/10 سنوات مع تسعير الأسواق لكل من رفع أسعار الفائدة على المدى القريب لمحاربة التضخم المدفوع بالنفط ومخاطر الركود على المدى الأطول.
سندات الشركات ذات الدرجة الاستثمارية: اتسعت الفروق بشكل معتدل، مع تضييق سندات قطاع الطاقة (تحسن الأساسيات الائتمانية) يقابله اتساع في القطاعات الاستهلاكية والصناعية والمالية.
العائد المرتفع: القطاع الأكثر عرضة. اتسعت فروق العائد المرتفع غير المتعلقة بالطاقة بمقدار 150-200 نقطة أساس منذ بداية الصراع، مع ضغط خاص على ائتمانات شركات الطيران والتجزئة والأسواق الناشئة.
الدين السيادي للأسواق الناشئة: انفجرت فروق السيادات المستوردة للنفط. تتداول سندات مصر المقومة بالدولار عند مستويات متعثرة (عوائد فوق 15%)، مما يعكس الضغط المركب لارتفاع تكاليف واردات الوقود على ميزان خارجي متوتر بالفعل.
أسواق العملات
تعزز الدولار بنسبة 4-6% على أساس مرجح بالتجارة منذ بداية الصراع، مدفوعاً بـ:
- تدفقات رأس المال الملاذ الآمن إلى الأصول الدولارية
- الاكتفاء الذاتي للطاقة الأمريكية يوفر عزلاً اقتصادياً نسبياً
- أسعار فائدة أمريكية أعلى مع استجابة الفيدرالي للتضخم المدفوع بالنفط
- ضعف عملات مستوردي النفط (الليرة التركية، الروبية الهندية، الجنيه المصري، الين الياباني)
بشكل متناقض، يصبح تعزز الدولار نفسه عاملاً في تسعير النفط. لأن النفط مقوم بالدولار، فإن الدولار الأقوى يجعل النفط أغلى بالعملة المحلية للمشترين من خارج الولايات المتحدة، مما يضخم تأثير تدمير الطلب في الدول المستوردة بينما يعزل المستهلكين الأمريكيين جزئياً.
المقارنة مع أزمات النفط التاريخية
حظر النفط العربي 1973
أقرب موازٍ تاريخي هو حظر 1973، عندما خفضت دول أوبك الإنتاج رداً على الدعم الأمريكي لإسرائيل خلال حرب أكتوبر. تضاعفت أسعار النفط أربع مرات من 3 إلى 12 دولاراً، مما أدى إلى ركود عالمي وإعادة هيكلة جوهرية لسياسة الطاقة. تشترك أزمة 2026 في السبب الجيوسياسي وميكانيكيات اضطراب العرض، رغم أن الاقتصاد العالمي أقل كثافة نفطية اليوم (انخفضت كثافة النفط في الناتج المحلي الإجمالي بحوالي الثلثين منذ 1973).
الثورة الإيرانية 1979
أزالت الثورة الإيرانية حوالي 5 ملايين برميل يومياً من العرض العالمي، دافعة الأسعار من 15 إلى 40 دولاراً ومساهمة في ركود أوائل الثمانينيات. يتضمن اضطراب 2026 حجماً مماثلاً أو أكبر من فقدان العرض الفعلي عند تضمين تدمير طاقة التكرير، لكن الاقتصاد العالمي يمتلك مصادر طاقة أكثر تنوعاً واحتياطيات استراتيجية أفضل تطوراً.
الدورة الفائقة للنفط 2008
وصل النفط إلى 147 دولاراً في يوليو 2008، مدفوعاً بالطلب الصيني المتصاعد والتموضع المضاربي بدلاً من اضطراب العرض. حركة أسعار 2026 مختلفة جوهرياً: إنها مدفوعة بالعرض، والتي تنتج تاريخياً ارتفاعات أسعار أكثر استمراراً من الارتفاعات المدفوعة بالطلب.
صدمة روسيا-أوكرانيا 2022
المقارنة الأحدث. ارتفع برنت إلى 130 دولاراً في مارس 2022 بعد غزو روسيا لأوكرانيا، لكنه تراجع بسرعة مع إيجاد النفط الروسي مشترين بديلين وتوفير إطلاقات الاحتياطي الاستراتيجي حاجزاً. وضع 2026 أكثر حدة لأن اضطراب العرض مادي (بنية تحتية مدمرة) وليس سياسياً (خاضع للعقوبات لكنه لا يزال ينتج)، مما يجعل التعافي أبطأ وأكثر غموضاً.
تداول الانعكاس: ما يفعله المحترفون
صفقات الفارق
يتعامل متداولو النفط المحترفون مع انعكاس فارق WTI-Brent بمزيج من الحذر والانتهازية. الصفقة الكلاسيكية – بيع المعيار الغالي وشراء الرخيص – تعقدها حالة عدم اليقين الاستثنائية لديناميكيات العرض الأساسية. تكبد المتداولون الذين باعوا الفارق المتقلص متوقعين الانعكاس خسائر كبيرة، وأغلق كثيرون مراكزهم أو انتقلوا إلى استراتيجيات قائمة على الخيارات بمخاطر محددة.
الاستراتيجية الأكثر شعبية حالياً بين المحترفين هي فارق زمني في WTI: شراء الشهر الأمامي وبيع شهر مؤجل (6-12 شهراً)، للاستفادة من التخلف الحاد. تربح هذه الصفقة إذا استمرت أزمة العرض قريبة المدى لكنها تطبعت بمرور الوقت – وهو الرأي المتفق عليه بين معظم المحللين.
صفقات هامش التكرير
كانت صفقة هامش التكرير – شراء عقود الخام الآجلة وبيع عقود البنزين والديزل الآجلة – الصفقة الفردية الأكثر ربحية في 2026. يقوم المكررون ذوو المصانع المادية بتثبيت الهوامش الآجلة عند مستويات تضمن الربحية حتى في ظل سيناريوهات ضغط شديدة. يكرر المتداولون الماليون هذه المراكز صناعياً، رغم تراجع العوائد مع ازدحام الصفقة.
استراتيجيات التقلب
التقلب الضمني لخيارات النفط عند أعلى مستوياته في عدة عقود، مما يجعل الخيارات مكلفة للمشترين لكنه يخلق فرصاً لمتداولي التقلب المتطورين. الاستراتيجيات مثل الكوندور الحديدي وفروق النسب التي تبيع خيارات مكلفة مع تحديد المخاطر شائعة بين المكاتب المؤسسية. ومع ذلك، فإن خطر حدث توسع في التقلب (مثل إغلاق هرمز) يعني أن استراتيجيات بيع التقلب تحمل مخاطر وجودية.
المسار المقبل: سيناريوهات الأسعار
الحالة الأساسية: 100-120 دولاراً حتى نهاية العام (احتمال 50%)
إذا ظل الصراع بالحدة الحالية دون تصعيد كبير، من المرجح أن تتذبذب أسعار النفط في نطاق 100-120 دولاراً خلال 2026. يتطبع فارق WTI-Brent إلى خصم صغير لـ WTI مع استقرار مخزونات كوشينغ. تدمير الطلب بالأسعار الحالية يحد من الصعود الإضافي، بينما اضطراب العرض المستمر يمنع الهبوط الكبير.
الحالة الصعودية: 130-150 دولاراً (احتمال 25%)
تصعيد الصراع أو مزيد من أضرار المصافي أو إغلاق هرمز الفعلي يدفع النفط فوق 130 دولاراً، مع احتمال ارتفاعات إلى 150 دولاراً. عند هذه المستويات، يتسارع تدمير الطلب بحدة، وتواجه البنوك المركزية مقايضات سياسية مستحيلة، ويصبح الركود العالمي مرجحاً للغاية. يصبح انعكاس WTI-Brent مستمراً مع تكثف قلق العرض الأمريكي.
الحالة الهبوطية: 80-95 دولاراً (احتمال 15%)
حل دبلوماسي أو وقف إطلاق نار يؤدي إلى تطبيع سريع لأسواق النفط. تنخفض الأسعار بحدة مع تبخر علاوة مخاطر الحرب، مع احتمال تجاوز الهبوط مع تفكيك المراكز المضاربية. يتطلب هذا السيناريو اتفاق سلام موثوقاً، وهو ما يبدو مستبعداً حالياً.
الحالة الطرفية: أكثر من 150 دولاراً (احتمال 10%)
حرب إقليمية شاملة تشمل تعطيل الإنتاج السعودي أو إغلاق هرمز تزيل ما يكفي من العرض لدفع الأسعار إلى مستويات لم تُشهد منذ ذروة 1979 المعدلة بالتضخم. سيفجر هذا السيناريو ركوداً عالمياً حاداً وربما أزمة مالية في الدول المستوردة للطاقة. ستُستنفد الاحتياطيات البترولية الاستراتيجية خلال أشهر.
ما ينبغي للمستثمرين فعله الآن
انعكاس WTI-Brent إشارة سوقية تتطلب الانتباه والعمل. بالنسبة للمستثمرين عبر فئات الأصول، التداعيات واضحة:
- احترم الإشارة: يخبرك الانعكاس أن سوق النفط يسعّر مخاطر لم يستوعبها معظم مستثمري الأسهم والسندات بالكامل. إذا لم تختبر محفظتك لضغط نفط مستدام فوق 110 دولارات، افعل ذلك الآن.
- تخصيص الطاقة: الترجيح الزائد لأسهم الطاقة، خاصة المنتجين والمكررين الأمريكيين، لا يزال مبرراً. هذه الشركات تولد تدفقات نقدية حرة استثنائية تدعم التوزيعات وإعادة الشراء. ومع ذلك، كن انتقائياً: تجنب شركات الطاقة المعرضة للخليج بمخاطر أصول غير قابلة للتأمين.
- تحوط التعرض للوقود: إذا كان عملك أو محفظتك معرضة بشكل كبير لتكاليف الوقود، التحوط بالمستويات الحالية يثبت تكاليف مرتفعة لكنها قد تثبت أنها صفقات نسبية إذا تحققت السيناريوهات الصعودية أو الطرفية.
- خفض مخاطر الأسواق الناشئة: تواجه الأسواق الناشئة المستوردة للنفط ضغطاً مركباً من تكاليف طاقة أعلى وعملات أضعف وتضخم أسعار غذاء محتمل. خفض التعرض للائتمانات السيادية والمؤسسية الأكثر عرضة في هذه الأسواق.
- استعد للتقلب: يخبرك سوق الخيارات أن المخاطر الطرفية تؤخذ على محمل الجد من المحترفين. أحجام المراكز يجب أن تكون أصغر من المعتاد، ونقاط الوقف أوسع، واحتياطيات السيولة أعلى.
كان انعكاس WTI-Brent بـ 64 سنتاً في 28 مارس 2026 همسة من السوق. لكن في سوق النفط، غالباً ما تسبق الهمسات من منحنى الفارق الصرخات من رسم الأسعار البياني. السوق يخبرنا بشيء. المستثمر الحكيم يصغي.
يستند هذا التحليل إلى بيانات السوق حتى 2 أبريل 2026. أسواق النفط متقلبة للغاية والأوضاع يمكن أن تتغير بسرعة. لا تشكل هذه المقالة نصيحة استثمارية. استشر مستشاراً مالياً مؤهلاً قبل اتخاذ قرارات استثمارية بناءً على هذا التحليل. تشمل المصادر بيانات إدارة معلومات الطاقة الأمريكية وإحصاءات سوق مجموعة CME.