السباق الثلاثي نحو الأهمية الاقتصادية
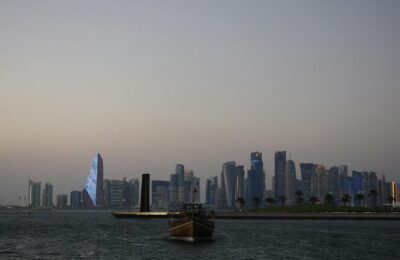
يُكتب مستقبل الشرق الأوسط الاقتصادي بثلاث لغات مختلفة. في القاهرة، اللغة هي الإصلاح الهيكلي — عملية صبورة ومؤلمة وموجهة من صندوق النقد الدولي لتحرير العملة والتماسك المالي والتحديث المؤسسي، تهدف لتحويل مصر من اقتصاد مدفوع بالاستهلاك إلى اقتصاد متنوع يرتكز على قناة السويس والسياحة والتحويلات وقطاع تصنيع متنامٍ. في أنقرة، اللغة هي القدرة الصناعية — رهان أن 85 مليون نسمة في تركيا، وبنية أمنية متحالفة مع الناتو، وموقع جغرافي يربط أوروبا بآسيا، وقاعدة تصنيع عميقة، يمكن أن تجعلها قوة تصدير شرق المتوسط. في الرياض، اللغة هي رأس المال السيادي — الاقتناع بأن 930 مليار دولار في أصول صندوق الاستثمارات العامة، مع أكبر احتياطيات نفط مثبتة في العالم، يمكن أن تموّل تحولاً اقتصادياً من القمة إلى القاعدة من دولة نفطية إلى اقتصاد معرفي ما بعد صناعي.
هذه النماذج الثلاثة ليست مجرد استراتيجيات مختلفة للنمو الاقتصادي. إنها تمثل نظريات مختلفة جوهرياً حول كيفية تحقيق الاقتصادات النامية للازدهار المستدام. يقول نموذج مصر: اتبع القواعد، وحرر الأسواق، واجذب الاستثمار الخاص، ودع الميزة النسبية تقود النمو. يقول نموذج تركيا: اصنع أشياء، وصدّرها، واستغل جغرافيتك. يقول نموذج السعودية: انشر رأس المال السيادي على نطاق واسع وابنِ المستقبل من الصفر.
لكل نموذج سوابق. يردد مسار مصر إصلاحات إجماع واشنطن في أمريكا اللاتينية وجنوب شرق آسيا. يعكس نهج تركيا التصنيع القائم على التصدير لكوريا الجنوبية وتايوان. تشبه استراتيجية السعودية التنمية الموجهة من الدولة في سنغافورة، لكن على نطاق أوسع بكثير ودون مزايا سنغافورة المؤسسية.

اختبر الصراع الإيراني النماذج الثلاثة في آن واحد — مسرّعاً بعض الاتجاهات ومعطلاً أخرى وكاشفاً نقاط ضعف كانت نظرية سابقاً. ما يلي تحليل مقارن مبني على مشاورات المادة الرابعة لصندوق النقد الدولي ومؤشرات التنمية للبنك الدولي وبيانات الاستثمار لمنظمة التعاون والتنمية وأحدث الإحصاءات الاقتصادية الكلية من كل بلد. السؤال ليس أي نموذج مثالي — لا يوجد — بل أيها يقدم المسار الأكثر استدامة نحو الازدهار في منطقة يجب أن تتجاوز النفط في نهاية المطاف.
مصر: عائد الإصلاح
الأطروحة
يُبنى النموذج الاقتصادي المصري على فرضية بسيطة لكنها قوية: أن اقتصاداً من 105 مليون نسمة يسيطر على أهم قناة شحن في العالم، مع قطاع سياحي تنافسي عالمياً، و30 مليار دولار في التحويلات السنوية، وقوة عاملة شابة متعلمة بشكل متزايد، يمكنه تحقيق نمو مستدام بنسبة 6-7% في الناتج المحلي الإجمالي إذا — وفقط إذا — نفّذت الحكومة إصلاحات هيكلية حقيقية تطلق ديناميكية القطاع الخاص.
هذا هو الرهان الذي وضعه الرئيس عبد الفتاح السيسي منذ الإصلاحات الاقتصادية التاريخية عام 2016، التي شملت تعويم الجنيه المصري وإدخال ضريبة القيمة المضافة وتخفيض دعم الطاقة والاتفاق على تسهيل تمويلي ممتد بقيمة 12 مليار دولار مع صندوق النقد الدولي. كانت الإصلاحات مؤلمة — ارتفع التضخم إلى 33%، وزادت معدلات الفقر في البداية، وكان السخط العام واضحاً. لكن المسار الاقتصادي الكلي منذ ذلك الحين كان، بأي مقياس موضوعي، مثيراً للإعجاب.
البيانات
بلغ متوسط نمو الناتج المحلي الإجمالي لمصر 5.3% سنوياً من 2017 إلى 2024، ما يجعلها أحد أسرع الاقتصادات نمواً في الشرق الأوسط وأفريقيا. زاد نصيب الفرد من الناتج المحلي الإجمالي (تعادل القوة الشرائية) من نحو 11,800 دولار في 2016 إلى 15,800 دولار في 2025 — زيادة 34% تمثل تحسناً ذا مغزى في مستويات المعيشة، حتى مع مراعاة التضخم وانخفاض قيمة العملة.
تحسنت الصورة المالية بشكل كبير. ظل الرصيد المالي الأولي — إيرادات الحكومة ناقص النفقات، باستثناء مدفوعات الفائدة — في فائض منذ 2018، بمتوسط نحو 2% من الناتج المحلي الإجمالي. هذا إنجاز لافت لاقتصاد كان يسجل عجزاً أولياً بنسبة 3-4% من الناتج في فترة قريبة تعود إلى 2015. انخفضت نسبة الدين العام إلى الناتج المحلي الإجمالي من 103% عام 2017 إلى نحو 88% في 2025، وتتوقع أحدث مشاورات المادة الرابعة لصندوق النقد الدولي استمرار الانخفاض إلى نحو 75% بحلول 2029.
ضاق عجز الحساب الجاري من 6% من الناتج المحلي الإجمالي في 2016 إلى نحو 2.8% في 2025، مدفوعاً بمزيج من نمو إيرادات قناة السويس وتعافي السياحة (التي بلغت 16 مليار دولار في 2025، رقم قياسي) وتدفقات التحويلات القوية. وفرت أزمة هرمز دفعة إضافية — زادت إيرادات قناة السويس بنحو 35%، وجذب موقع مصر كطريق شحن بديل استثمارات جديدة كبيرة.
كان الاستثمار الأجنبي المباشر الحلقة الأضعف في قصة إصلاح مصر. تدفقات الاستثمار الأجنبي المباشر، عند نحو 9 مليارات دولار في 2025، تبقى دون هدف 14 مليار دولار الذي حددته الحكومة ودون المستويات التي يحتاجها الاقتصاد لتحقيق طموحات النمو. الأسباب هيكلية: التعقيد البيروقراطي، والدور المهيمن للجيش في قطاعات اقتصادية معينة، وعدم اتساق إنفاذ اللوائح، والمخاوف المتبقية بشأن استقرار العملة — كل ذلك يردع المستثمرين الأجانب الذين قد تجذبهم ديموغرافيات مصر وحجم سوقها.
نقاط القوة
يتمتع النموذج المصري بعدة مزايا لا يقدّرها المراقبون الخارجيون بالقدر الكافي.
قناة السويس أصل لا يمكن استبداله. لا تسيطر أي دولة أخرى على نقطة اختناق مماثلة للتجارة العالمية. تولّد القناة نحو 10 مليارات دولار في الإيرادات السنوية (ارتفاعاً من 5.6 مليار في 2020)، وزادت قيمتها فقط مع إثبات أزمة هرمز للعلاوة التي يضعها السوق على طرق الشحن الآمنة. على عكس النفط، لا تواجه قناة السويس تدمير الطلب من التحول في الطاقة — بل إن نمو التجارة العالمية وزيادة حجم سفن الحاويات يعززان قيمتها بمرور الوقت.
الديموغرافيا ميزة حقيقية. يمثل سكان مصر البالغ عددهم 105 مليون نسمة، بمتوسط عمر 24 عاماً، عائداً ديموغرافياً هائلاً — إذا استطاع الاقتصاد توليد توظيف كافٍ. تنمو القوة العاملة بنحو 800,000 عامل سنوياً، ما يخلق تحدياً (الحاجة لخلق فرص عمل) وفرصة (إمكانية نمو التصنيع والخدمات كثيفة العمالة).
زخم الإصلاح حقيقي. بنى سجل مصر في تنفيذ الإصلاحات خلال العقد الماضي — مهما كان ناقصاً — مصداقية لدى المؤسسات المالية الدولية ووكالات التصنيف الائتماني. حافظت البلاد على تعامل مستمر مع صندوق النقد الدولي، ونفّذت تغييرات سياسية صعبة متعددة، وأظهرت استعداداً لتحمل التكاليف السياسية قصيرة الأجل من أجل المنفعة الاقتصادية طويلة الأجل.
الدعم المالي الخليجي يوفر حاجزاً. قدمت السعودية والإمارات والكويت مجتمعة نحو 55 مليار دولار في ودائع واستثمارات ودعم مالي لمصر منذ 2013. يوفر هذا الدعم — الذي يعكس المصلحة الاقتصادية والتوافق الجيوسياسي — وسادة مالية لا تتمتع بها معظم الدول النامية. أظهرت صفقة تطوير رأس الحكمة مع الإمارات، التي جلبت 35 مليار دولار في التزامات استثمارية، حجم رأس المال الخليجي المتاح لمصر.
المخاطر
لا يخلو النموذج المصري من مخاطر كبيرة.
الأخطر هو عبء خدمة الدين. رغم انخفاض نسبة الدين إلى الناتج المحلي الإجمالي، تستهلك مدفوعات خدمة الدين الفعلية لمصر نحو 45% من إيرادات الحكومة — نسبة لا تترك إلا حيزاً مالياً محدوداً للاستثمار في التعليم والرعاية الصحية والبنية التحتية. الحصة العالية من الدين المقوم بالعملات الأجنبية (نحو 35% من إجمالي الدين العام) تعني أن أي انخفاض كبير في قيمة الجنيه يزيد فوراً عبء الدين.
التضخم، رغم انخفاضه عن ذروة 2017، يظل مرتفعاً هيكلياً عند نحو 18-22%. حافظ البنك المركزي على أسعار فائدة مرتفعة (نحو 25%) لاحتواء التضخم، لكن هذه السياسة تخلق توتراً مع الحاجة لائتمان ميسور لدعم نمو القطاع الخاص.
يظل القطاع الخاص أصغر مما ينبغي. تستمر الشركات المملوكة للدولة والشركات التابعة للجيش في الهيمنة على قطاعات رئيسية، مزاحمة الاستثمار الخاص ومولّدة تشوهات تنافسية أشار إليها صندوق النقد الدولي مراراً. التزمت الحكومة ببرنامج خصخصة، لكن التنفيذ كان أبطأ من المخطط.
تركيا: رهان التصنيع
الأطروحة
يرتكز النموذج الاقتصادي التركي على الاعتقاد بأن مزيج البلاد من الحجم والموقع والقدرة الصناعية والتطور المؤسسي يمكن أن يدعم استراتيجية نمو قائمة على التصدير مشابهة للنموذج الشرق آسيوي — مكيّفة للسياق الشرق أوسطي ومستغلة موقع تركيا الفريد كجسر بين أوروبا والشرق الأوسط وآسيا الوسطى.
الأطروحة مقنعة على الورق. لدى تركيا أكبر قطاع تصنيع في الشرق الأوسط، وقاعدة تصدير متنوعة تمتد عبر السيارات والمنسوجات والآلات والإلكترونيات ومعدات الدفاع، وقدرة مثبتة على إنتاج سلع بمستويات جودة مقبولة للأسواق الأوروبية بتكاليف تنافسية مع المصنعين الآسيويين. صادرات البلاد البالغة 255 مليار دولار سنوياً (2025) تجعلها بالفعل اقتصاداً تجارياً رئيسياً، وهدف الحكومة هو بلوغ 400 مليار دولار بحلول 2030.
البيانات
ناتج تركيا المحلي الإجمالي، بنحو 1.15 تريليون دولار بالقيمة الاسمية و3.3 تريليون دولار بتعادل القوة الشرائية، يجعلها أكبر اقتصاد في الشرق الأوسط والـ 19 عالمياً. نصيب الفرد من الناتج (تعادل القوة الشرائية) عند نحو 38,000 دولار هو الأعلى بين البلدان الثلاثة المقارنة.
يمثل قطاع التصنيع نحو 22% من الناتج المحلي الإجمالي ويوظف نحو 5 ملايين عامل — أرقام محترمة بأي معيار لكنها تخفي تحديات كبيرة في الجودة والإنتاجية. إنتاجية التصنيع التركية، عند نحو 28,000 دولار لكل عامل، أقل من نصف المتوسط الأوروبي ونمت بشكل أبطأ من الإنتاجية في اقتصادات منافسة مثل بولندا ورومانيا وفيتنام.
كانت الصادرات النقطة المضيئة. بلغت الصادرات السلعية التركية 255 مليار دولار في 2025، ارتفاعاً من 170 مليار في 2020 — زيادة 50% تعكس التعافي من كوفيد-19 والتحول الهيكلي نحو تنافسية التصنيع. تنوّع مزيج الصادرات بشكل كبير: السيارات (38 مليار دولار)، والآلات والمعدات (22 مليار)، والإلكترونيات (18 مليار)، والدفاع والفضاء (12 مليار) نمت جميعها بسرعة.
وفرت أزمة هرمز دفعة إضافية للصادرات التركية. المشترون الأوروبيون والشرق أوسطيون، الساعون لتنويع سلاسل إمدادهم بعيداً عن المناطق المتأثرة بالصراع، توجهوا إلى المصنعين الأتراك كبديل موثوق. زادت طلبات التصنيع التركية بنحو 22% في الربع الأول من 2026 مقارنة بنفس الفترة في 2025 — أقوى نمو ربعي في عقد.
الحساب الجاري، كعب أخيل تركيا التاريخي، تحسّن لكنه يظل في عجز. ضاق عجز الحساب الجاري من 5.5% من الناتج في 2023 إلى نحو 2.8% في 2025. لكن اعتماد تركيا على واردات الطاقة — تستورد البلاد نحو 75% من احتياجاتها من الطاقة — يعني أن أسعار النفط المرتفعة (108 دولارات للبرميل) تمثل رياحاً معاكسة كبيرة.
نقاط القوة
الميزة الجغرافية دائمة. موقع تركيا عند مفترق طرق أوروبا وآسيا والشرق الأوسط ميزة هيكلية مستدامة لا يمكن لأي تغيير في السياسات تكراره في مكان آخر.
القاعدة الصناعية عميقة ومتنوعة. على عكس كثير من الاقتصادات النامية المتخصصة في نطاق ضيق من الصادرات، بنت تركيا قطاع تصنيع يمتد عبر صناعات ومستويات تعقيد متعددة.
عضوية الناتو توفر الأمن والوصول للأسواق. عضوية تركيا في الناتو، مع اتحادها الجمركي مع الاتحاد الأوروبي، توفر أطراً مؤسسية للتجارة والاستثمار تفتقر إليها معظم اقتصادات الشرق الأوسط.
دور نقل الطاقة ينمو. تعزز موقع تركيا كممر عبور لطاقة آسيا الوسطى وبحر قزوين والشرق الأوسط بشكل متزايد بفعل أزمة هرمز.
المخاطر
يواجه النموذج التركي ثلاثة تحديات هيكلية يمكن أن تعرقل مسار نموه.
الأكثر إلحاحاً هو التضخم. رغم عودة البنك المركزي إلى السياسة النقدية التقليدية في منتصف 2024، يظل التضخم نحو 38% سنوياً — انخفاضاً من ذروة 85% في 2023 لكنه لا يزال مرتفعاً بشكل كارثي بمعايير بلد يطمح أن يكون مصدّراً صناعياً رئيسياً.
ضعف الليرة المزمن يفاقم تحدي التضخم. انخفضت الليرة التركية من 1.5 مقابل الدولار عام 2013 إلى نحو 42 مقابل الدولار في مطلع 2026 — انخفاض 96% يوفر تنافسية تصدير مؤقتة لكنه دمّر القوة الشرائية للأسر.
جودة المؤسسات هي التحدي الهيكلي الأعمق. تراجع تصنيف تركيا في مؤشرات الحوكمة للبنك الدولي عبر كل بُعد — سيادة القانون، والجودة التنظيمية، وفعالية الحكومة، ومكافحة الفساد — خلال العقد الماضي.
السعودية: رهان رأس المال السيادي
الأطروحة
النموذج الاقتصادي السعودي غير مسبوق في الحجم والطموح. الأطروحة: أن صندوق ثروة سيادية بقيمة 930 مليار دولار (صندوق الاستثمارات العامة)، مع إيرادات من أكبر احتياطيات نفط مثبتة في العالم، يمكن أن يموّل تحولاً اقتصادياً من القمة إلى القاعدة يبني صناعات جديدة بالكامل — السياحة والترفيه والخدمات المالية والتقنية والدفاع — في بلد اعتمد تاريخياً على الهيدروكربونات في 60-70% من إيراداته الحكومية.
رؤية 2030، التي أعلنها ولي العهد الأمير محمد بن سلمان عام 2016، هي المخطط. أهدافها طموحة: زيادة الإيرادات غير النفطية من 163 مليار ريال إلى تريليون ريال، وزيادة الاستثمار الأجنبي المباشر من 3.8% إلى 5.7% من الناتج المحلي الإجمالي، وتخفيض البطالة من 11.6% إلى 7%، وزيادة مشاركة المرأة في القوى العاملة من 17% إلى 30%.
البيانات
كان التقدم نحو هذه الأهداف متبايناً لكنه، في المجمل، أكثر إيجابية مما توقعه المنتقدون.
نما الناتج المحلي الإجمالي غير النفطي بمعدل 4.8% سنوياً منذ 2016، وتضاعفت الإيرادات غير النفطية ثلاث مرات تقريباً من 163 مليار إلى نحو 450 مليار ريال. زادت حصة القطاع غير النفطي من إجمالي الناتج من نحو 43% إلى 50% — تحول ذو مغزى، وإن كان لا يزال دون مستويات التنويع في اقتصادات مثل الإمارات (نحو 70% ناتج غير نفطي).
كانت السياحة النجاح الأكثر وضوحاً. استقطبت السعودية نحو 27 مليون سائح دولي في 2025، ارتفاعاً من 15 مليون في 2019. بلغت إيرادات السياحة نحو 40 مليار دولار، ما يجعلها أسرع سوق سياحي نمواً عالمياً.
تجاوزت مشاركة المرأة في القوى العاملة هدف رؤية 2030 الأصلي، لتصل إلى نحو 33% — ارتفاعاً من 17% في 2016. هذا أحد أكثر التحولات الاجتماعية والاقتصادية أهمية في تاريخ السعودية، أضاف نحو 1.2 مليون امرأة إلى سوق العمل.
كان الاستثمار الأجنبي المباشر مخيباً مقارنة بالأهداف. تدفقات الاستثمار الأجنبي السنوية، عند نحو 8 مليارات دولار في 2025، تبقى دون هدف الحكومة البالغ 25 مليار دولار سنوياً.
خلق الصراع الإيراني تحديات وفرصاً لرؤية 2030. من جانب التحديات، أعاد صندوق الاستثمارات العامة توجيه ما يقدر بـ 45 مليار دولار من المشاريع الضخمة المحلية إلى مراكز دفاعية. خُفضت ميزانية نيوم بنحو 30%، ومُدد الجدول الزمني لبناء ذا لاين بـ 2-3 سنوات. من جانب الفرص، ولّدت أسعار النفط المرتفعة نحو 40 مليار دولار في إيرادات حكومية إضافية.
نقاط القوة
الموارد المالية لا مثيل لها. لا يتمتع أي اقتصاد نامٍ آخر بمزيج إيرادات النفط والثروة السيادية الذي تمتلكه السعودية. أصول صندوق الاستثمارات العامة البالغة 930 مليار دولار، مع إيرادات نفطية سنوية تقارب 250 مليار دولار، توفر طاقة استثمارية تقزّم أي شيء متاح لمصر أو تركيا.
العائد الديموغرافي حقيقي. سكان السعودية البالغ عددهم 36 مليوناً، بمتوسط عمر 31 عاماً، شباب ومتعلمون بشكل متزايد.
التحول في الطاقة يخلق فرصة. بشكل متناقض، قد يفيد التحول العالمي في الطاقة السعودية أكثر مما يضرها. كأقل منتج تكلفة (بتكاليف إنتاج نحو 5-8 دولارات للبرميل)، ستكون السعودية آخر منتج صامد مع إغلاق الإنتاج الأعلى تكلفة.
المخاطر
يحمل نموذج رأس المال السيادي مخاطر تتناسب مع طموحه.
مخاطر التنفيذ الأكثر وضوحاً. بناء صناعات جديدة في بلد بدون تقاليد عميقة للقطاع الخاص وسلاسل إمداد راسخة وخبرة مؤسسية في الأسواق التنافسية صعب للغاية.
الاعتماد على إيرادات النفط لتمويل التنويع يخلق مشكلة منطق دائري. إذا انخفضت أسعار النفط، تتقلص الموارد المالية المتاحة للتنويع تحديداً عندما تكون أكثر حاجة إليها. قدّر صندوق النقد الدولي أن سعر النفط التعادلي المالي للسعودية نحو 90 دولاراً للبرميل.
يظل تحول سوق العمل التحدي الهيكلي الأعمق. رغم التقدم في توطين القوى العاملة (السعودة)، يظل القطاع الخاص معتمداً بشدة على العمالة الوافدة.
تحليل مقارن: خمسة أبعاد
1. مسار نمو الناتج المحلي الإجمالي
تمتلك مصر أقوى إمكانية نمو هيكلية بين الثلاثة، مدفوعة بعائدها الديموغرافي ومجال اللحاق بالإنتاجية. يتوقع صندوق النقد الدولي نمو مصر بنسبة 5.5-6.0% سنوياً حتى 2030، بافتراض استمرار تنفيذ الإصلاحات. إمكانية نمو تركيا نحو 4.0-4.5%، مقيدة بالتضخم والتحديات المؤسسية. نمو السعودية الأكثر تقلباً، متوقع بين 3.5-5.0% حسب أسعار النفط وتنفيذ رؤية 2030.
2. استدامة الدين
تمتلك تركيا أقوى وضع ديني، مع دين عام عند نحو 30% من الناتج المحلي الإجمالي. تدهور وضع السعودية الديني من قرب الصفر في 2014 إلى نحو 30% من الناتج في 2025. وضع مصر الديني الأكثر تقييداً عند نحو 88% من الناتج، رغم أن المسار يتحسن.
3. جاذبية الاستثمار الأجنبي المباشر
تجذب تركيا أكبر حجم من الاستثمار الأجنبي المباشر بالأرقام المطلقة (نحو 13 مليار دولار في 2025). استثمار مصر الأجنبي (9 مليارات) ينمو لكن يبقى دون الإمكانات. استثمار السعودية الأجنبي (8 مليارات) الأكثر إحباطاً مقارنة بطموحات الحكومة.
4. إصلاح سوق العمل
هذا البُعد الذي تواجه فيه البلدان الثلاثة أشد قيودها — وحيث سيحدد النجاح أو الفشل في نهاية المطاف أي نموذج يسود.
تحدي سوق العمل المصري هو خلق الوظائف. تحدي تركيا هو الإنتاجية. تحدي السعودية هو توطين القوى العاملة.
5. المرونة أمام الصدمات الخارجية
وفرت أزمة هرمز اختباراً حقيقياً لمرونة كل نموذج.
أظهرت مصر مرونة مفاجئة، مع توفير قناة السويس تحوطاً طبيعياً ضد الصراع والدعم المالي الخليجي وسادة مالية. استمر برنامج الإصلاح خلال الأزمة، ما يشير إلى أن أسس النموذج قوية بما يكفي لتحمل ضغط خارجي كبير.
استفادت تركيا من الأزمة عبر زيادة الطلب على التصنيع وإيرادات نقل الطاقة، لكن مشكلة التضخم تفاقمت بأسعار النفط المرتفعة.
أظهرت السعودية أكبر قابلية للتأثر، مع انخفاض أحجام تصدير النفط بشكل كبير رغم الأسعار المرتفعة، وإعادة توجيه استثمارات رؤية 2030 لإدارة الأزمة.
الحكم: تقييم صادق
لا يوجد نموذج “أفضل” واحد بين الثلاثة — كل منها يمثل استجابة عقلانية لظروف بدء وموارد وقيود سياسية مختلفة. لكن التقييم الصادق يمكنه تحديد أي نموذج يقدم المسار الأكثر استدامة نحو الازدهار طويل الأجل.
نموذج التصنيع-التصدير التركي هو الأكثر إثباتاً. يقدم تاريخ التنمية الاقتصادية أمثلة عديدة لبلدان حققت ازدهاراً مستداماً عبر التصنيع القائم على التصدير. تمتلك تركيا القاعدة الصناعية والميزة الجغرافية والوصول للأسواق لاتباع هذا المسار. القيود مفروضة ذاتياً: التضخم وعدم استقرار العملة والتآكل المؤسسي خيارات سياسية وليست حتميات هيكلية.
نموذج الإصلاح المصري يُظهر أكبر تحسن هيكلي. تحوّل المركز المالي المصري من عجز مزمن إلى فائض أولي، وتحرير سعر الصرف، وتخفيض دعم الطاقة تمثل إصلاحات حقيقية وصعبة وضعت الاقتصاد على مسار أكثر استدامة. توفر قناة السويس والسياحة والتحويلات قاعدة إيرادات متنوعة تقلل الاعتماد على أي قطاع بمفرده.
كاقتصاد شرق أوسطي يبني من نقطة انطلاق صعبة، يستحق تقدم مصر الاعتراف. لم تنجُ البلاد فحسب من عقد من الإصلاح — بل حسّنت جوهرياً موقفها الاقتصادي الكلي، واستقطبت مستويات قياسية من الاستثمار الخليجي، وموضعت نفسها كعقدة حاسمة في شبكة التجارة العالمية. الطريق أمامها شديد الانحدار، لكن الاتجاه صحيح.
نموذج رأس المال السيادي السعودي هو الأكثر طموحاً لكنه الأكثر عدم يقين. الحجم الهائل للموارد المالية المتاحة للمملكة يوفر مرونة لا يتمتع بها أي بلد آخر في المنطقة. لكن الموارد المالية وحدها لا تضمن تحولاً اقتصادياً ناجحاً. يعتمد نجاح رؤية 2030 النهائي على ما إذا كان الاستثمار السيادي يمكنه تحفيز نشاط القطاع الخاص الذاتي الاستدامة بدلاً من خلق اقتصاد يعتمد بشكل دائم على الإنفاق الحكومي.
التقييم الأكثر واقعية أنه لن يهيمن نموذج واحد. البلدان التي تحقق الازدهار الأكثر استدامة ستجمع على الأرجح بين عناصر من الثلاثة — انضباط مصر المالي وإصلاحها المؤسسي، وتنافسية التصنيع والتوجه التصديري لتركيا، واستخدام السعودية الاستراتيجي لرأس المال السيادي لبناء صناعات جديدة. مستقبل الشرق الأوسط الاقتصادي ليس منافسة بفائز واحد. إنه تجربة بثلاثة نهج متوازية، كل منها يولّد دروساً يمكن للآخرين تكييفها.
التداعيات للمستثمرين وصنّاع السياسات
للمستثمرين الذين يقيّمون الفرص عبر الشرق الأوسط، يشير التحليل المقارن إلى عدة استنتاجات عملية.
تقدم مصر أفضل عوائد معدلة بالمخاطر لرأس المال الصبور. مزيج الأساسيات الاقتصادية الكلية المتحسنة والديموغرافيا الجذابة والأصول الاستراتيجية (قناة السويس) والتقييمات التي تعكس تحديات البلاد الماضية بدلاً من مسارها المستقبلي يخلق عرضاً استثمارياً يكافئ الأفق متعدد السنوات.
تقدم تركيا أعلى إمكانية نمو فورية في التصنيع والصادرات. المستثمرون ذوو الخبرة في العمليات الصناعية وإدارة سلاسل الإمداد وتقنية التصنيع سيجدون النظام البيئي التركي الأكثر تطوراً والأكثر قابلية للاستثمار فوراً.
تقدم السعودية تعرضاً لأكثر تحول طموحاً في المنطقة. يخلق حجم استثمار رؤية 2030 فرصاً هائلة في البناء والتقنية والترفيه والسياحة والخدمات المالية. لكن علاوة مخاطر التنفيذ مرتفعة.
لصنّاع السياسات عبر المنطقة، الدرس الرئيسي أن التنويع الاقتصادي ليس استراتيجية واحدة بل محفظة من النهج. أنجح الاقتصادات ستكون تلك التي تحافظ على الانضباط المالي (درس مصر)، وتبني تنافسية التصنيع (درس تركيا)، وتنشر رأس المال السيادي بشكل استراتيجي (درس السعودية).
أكبر ثلاثة اقتصادات غير نفطية في الشرق الأوسط تجري كل منها تجربة مختلفة. النتائج، التي ستستغرق عقداً أو أكثر لتتبلور بالكامل، ستحدد المسار الاقتصادي للمنطقة لجيل كامل. الرهانات لا يمكن أن تكون أعلى — والعالم يراقب.