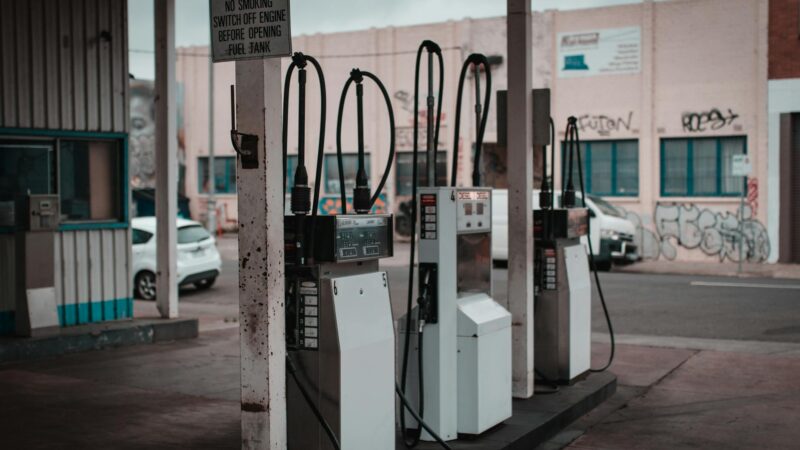
April Shock: UAE Fuel Prices Record Largest Monthly Jump in Years
Residents across the United Arab Emirates woke up on the first day of April 2026 to a painful reality at the fuel pump: unprecedented month-on-month increases ranging from 31% to 72% across all fuel grades. These are not abstract numbers on a price board — they represent a direct hit to the monthly budget of every household, commuter, and business in the country, arriving against the backdrop of a regional crisis where the Iran war, Strait of Hormuz disruptions, and surging global oil prices have converged into a perfect storm.
In this comprehensive analysis, we break down everything you need to know: the new prices in detail, exactly how much more you will pay each month, the real reasons behind the surge, how the UAE compares to regional and global fuel costs, and the practical steps you can take to manage this new reality.
Fuel Price Table: March vs. April 2026
| Fuel Type | March 2026 (AED/liter) | April 2026 (AED/liter) | Increase (AED) | % Increase |
|---|---|---|---|---|
| Super 98 | 2.59 | 3.39 | +0.80 | +31% |
| Special 95 | 2.48 | 3.28 | +0.80 | +32% |
| E-plus 91 | 2.40 | 3.17 | +0.77 | +32% |
| Diesel | 1.91 | 3.29 | +1.38 | +72% |
The most shocking figure is diesel’s 72% surge — a staggering increase that will ripple directly through commercial transport, logistics, and delivery costs, ultimately affecting the price of everything that moves by truck in the country.

How Much Will You Pay Monthly? A Detailed Cost Calculator
Let us translate these numbers into the daily reality of living in the UAE. We have calculated monthly costs for five common driving profiles:
| Driver Profile | Monthly Distance | Est. Fuel Consumption | March Cost (Special 95) | April Cost (Special 95) | Monthly Increase |
|---|---|---|---|---|---|
| Average driver (sedan) | 1,500 km | ~120 liters (8L/100km) | AED 298 | AED 394 | +AED 96 |
| Heavy commuter (sedan) | 3,000 km | ~240 liters | AED 595 | AED 787 | +AED 192 |
| Family SUV | 2,000 km | ~240 liters (12L/100km) | AED 595 | AED 787 | +AED 192 |
| Large SUV (Patrol/Land Cruiser) | 2,000 km | ~320 liters (16L/100km) | AED 794 | AED 1,050 | +AED 256 |
| Commercial diesel truck | 5,000 km | ~1,500 liters (30L/100km) | AED 2,865 | AED 4,935 | +AED 2,070 |
The numbers are clear: an average sedan driver will pay approximately AED 100 more per month. Families with large SUVs or multiple vehicles face increases of AED 200-400 monthly. Commercial operators — particularly trucking and delivery companies — bear the heaviest burden by far, with diesel cost increases measured in thousands of dirhams.
On an annual basis, this translates to an additional AED 1,150 to AED 3,070 per year for individual drivers, and significantly more for families with two or more vehicles. These are not trivial sums, particularly for middle-income households.
Why Did Prices Jump? The Direct Link to Hormuz and the Iran Conflict
The primary driver behind this sharp increase is no mystery: the Strait of Hormuz crisis and the ongoing war with Iran. The strait, through which approximately 20% of the world’s oil supply transits, has become an active conflict zone, producing several cascading effects:
1. Global oil price surge: Brent crude has exceeded $111 per barrel, with West Texas Intermediate (WTI) above $108. These are levels not seen since the Russia-Ukraine crisis of 2022. Higher crude prices translate directly into higher prices for refined products like gasoline and diesel.
2. Refining disruptions: Despite being a major oil producer, the UAE partially relies on imports of certain refined products. The disruption to tanker traffic through the strait has affected the entire supply chain.
3. Maritime insurance costs: Insurance companies have sharply raised premiums for tankers operating in Gulf waters, adding to the cost of transporting and distributing petroleum products.
4. Diesel’s disproportionate increase: The larger surge in diesel (72%) compared to gasoline (31-32%) reflects diesel’s tighter linkage to crude oil prices and the fact that global diesel demand rises disproportionately during crises due to its use in commercial transport, industrial operations, and power generators.
It is worth recalling that fuel prices in the UAE have been set monthly by the Fuel Price Follow-up Committee since 2015, based on global oil and refined product prices. There is no direct government subsidy on gasoline, unlike in some other Arab nations.
The Security Context: UAE Under Direct Attack
Adding to the severity of the situation is the fact that the UAE itself has become a direct target in the Iran conflict. Iranian missile and drone attacks have resulted in 13 fatalities and 217 injuries on UAE soil. This is not a distant war — it is a daily reality for residents.
The government has extended distance learning until April 17 due to security concerns. All banks have also discontinued SMS-based one-time passwords in favor of mandatory app-based authentication — a security measure that reflects the threat level the country is managing.
This security backdrop amplifies the psychological impact of rising fuel prices. Residents are not merely dealing with higher living costs but with a general state of uncertainty and security anxiety that affects spending and saving decisions across the board.
Historical Context: UAE Fuel Prices Over the Past Two Years
| Month | Super 98 (AED/liter) | Special 95 (AED/liter) | Diesel (AED/liter) |
|---|---|---|---|
| April 2024 | 2.86 | 2.74 | 2.81 |
| July 2024 | 2.95 | 2.83 | 2.88 |
| October 2024 | 2.68 | 2.57 | 2.73 |
| January 2025 | 2.45 | 2.33 | 2.51 |
| April 2025 | 2.52 | 2.41 | 2.44 |
| July 2025 | 2.61 | 2.49 | 2.55 |
| October 2025 | 2.48 | 2.37 | 2.38 |
| January 2026 | 2.41 | 2.30 | 2.19 |
| February 2026 | 2.50 | 2.39 | 2.02 |
| March 2026 | 2.59 | 2.48 | 1.91 |
| April 2026 | 3.39 | 3.28 | 3.29 |
The data reveals that gasoline prices had generally fluctuated between AED 2.30 and AED 2.95 per liter over the past two years. The April 2026 jump to AED 3.28-3.39 represents a clear departure from the established range and marks the highest prices in several years.
Diesel tells an even more dramatic story. It had been gradually declining from AED 2.81 in April 2024 to AED 1.91 in March 2026, then suddenly leaped to AED 3.29 — more than doubling in a single month. This reflects the acute disruption in global diesel markets caused by the Hormuz crisis.
Regional Comparison: Are UAE Residents Paying More Than Their Neighbors?
| Country | Approx. 95 Octane Price (AED/liter equiv.) | Government Subsidy | Notes |
|---|---|---|---|
| UAE | 3.28 | None | Free market pricing |
| Saudi Arabia | ~2.50 | Partial | Government price caps |
| Oman | ~2.85 | Limited | Gap narrowing |
| Bahrain | ~2.40 | Moderate | Greater subsidy for nationals |
| Kuwait | ~0.90 | Heavy | Cheapest fuel in the Gulf |
| Qatar | ~2.10 | Partial | Relatively stable prices |
The comparison reveals that the UAE now has the highest fuel prices in the GCC as of April 2026, surpassing Oman and Saudi Arabia. Kuwait remains the cheapest by a wide margin thanks to heavy government subsidies. Saudi Arabia, Bahrain, and Qatar maintain lower prices through various price cap and subsidy mechanisms.
This differential stems from the UAE’s 2015 decision to fully liberalize fuel prices and link them to global markets — a sound economic policy in normal times that reduces the burden on government finances, but one that means consumers absorb the full impact of price shocks during crises.
Global Comparison: Are UAE Prices Actually High?
| Country | Approx. Price per Liter (AED equiv.) | vs. UAE |
|---|---|---|
| UAE | 3.28 | — |
| United States | ~3.80 | 16% higher |
| United Kingdom | ~7.20 | 120% higher |
| Germany | ~7.50 | 128% higher |
| India | ~4.10 | 25% higher |
| Egypt | ~2.70 | 18% lower |
| Turkey | ~5.20 | 58% higher |
The global comparison shows that UAE fuel prices, despite this month’s sharp increase, remain well below European levels. However, this comparison is partially misleading because it does not account for the difference in distances driven: UAE motorists typically drive significantly farther than their European counterparts due to the sprawling nature of cities and the absence of comprehensive public transit networks.
Impact on Delivery Services, Taxis, and Ride-Hailing
The delivery and ride-hailing sector is among the hardest hit by rising fuel prices. Careem, Uber, Noon, and Talabat drivers — who form an army of independent contractors — bear fuel costs out of their own pockets.
Direct impact on app-based drivers:
- An average Uber/Careem driver covers approximately 200-250 km daily
- In an economy car consuming 7L/100km, that means 14-17.5 liters per day
- Additional daily cost: approximately AED 11-14
- Additional monthly cost (25 working days): AED 275-350
- This equates to a 5-7% reduction in their monthly income
Careem has announced a temporary fuel surcharge of AED 2 per ride in Dubai and Abu Dhabi. Uber has added a similar surcharge of AED 1.5. These fees partially offset the burden on drivers but increase transportation costs for passengers.
Food delivery services: Companies like Talabat, Noon, and Deliveroo face mounting pressure. Delivery fees have already risen by an average of AED 2-3 per order, and some restaurants have increased their in-app menu prices by 3-5% to offset higher supply costs.
Impact on Food Prices and Inflation
Diesel’s 72% surge will generate multi-layered inflationary pressure across the entire UAE economy. The logic is simple: everything moves by truck, and trucks run on diesel.
The chain of impact:
- Road freight: The cost of transporting goods from ports and warehouses to retail outlets has risen immediately. Logistics companies have announced rate increases of 15-25%.
- Fresh food: Vegetables, fruits, and meats — which require refrigerated trucks consuming even more diesel — will see the largest price increases. Forecasts suggest a 5-10% rise in food prices during April and May.
- Construction: Transporting building materials (cement, steel, sand) now costs more, which will increase the cost of construction and infrastructure projects.
- Retail: Retail stores will pass a portion of higher transport costs to consumers, particularly for heavy goods like electronics and furniture.
Central Bank estimates suggest that a fuel price increase of this magnitude could add 0.5-0.8 percentage points to the April inflation rate, pushing it to approximately 3.5-4% on an annual basis — the highest level since mid-2023.
The Electric Vehicle Alternative: Is Now the Time to Switch?
With every fuel price spike, the same question resurfaces: has switching to an electric vehicle become an economically rational decision in the UAE?
Comparative cost analysis:
| Comparison | Petrol Car (Toyota Camry) | Electric Car (Tesla Model 3) |
|---|---|---|
| Monthly “fuel” cost (2,000 km) | ~AED 525 (Special 95) | ~AED 110 (home charging) |
| Monthly savings | — | ~AED 415 |
| Annual savings | — | ~AED 4,980 |
| New car price | ~AED 110,000 | ~AED 180,000 |
| Price difference | — | ~AED 70,000 |
| Payback period | — | ~14 years |
The calculation reveals that switching to electric genuinely saves on running costs, but the purchase price premium remains substantial. At current fuel prices, it would take approximately 14 years to recoup the price difference through fuel savings alone — longer than the practical lifespan of most vehicles.
However, the equation shifts when you factor in:
- Lower maintenance costs: EVs require significantly less maintenance (no oil changes, no filters, no belts)
- Government incentives: Free parking, free registration, and customs exemptions for EVs in some emirates
- Future fuel price increases: If the Hormuz crisis persists and prices remain elevated, the payback period shortens considerably
- Charging infrastructure: The UAE boasts a mature charging network with over 1,000 stations across Abu Dhabi, Dubai, and Sharjah
The bottom line: switching to electric makes economic sense for high-mileage drivers (more than 80 km daily) and environmental sense for everyone, but it remains a decision contingent on the financial ability to absorb the higher initial purchase cost.
Will the Government Intervene With Subsidies?
A question on many minds: will the UAE government step in to subsidize fuel prices if they remain elevated?
The short answer: most likely not, at least not in the form of direct fuel subsidies. Here is why:
1. Commitment to price liberalization: The UAE’s 2015 decision to deregulate fuel pricing was part of structural economic reforms. Reversing it would send a negative signal to markets and international institutions and undermine the credibility of economic policy.
2. Consumer purchasing power: Average per capita income in the UAE remains among the world’s highest. The government views the fuel price increase as a manageable burden for most residents, even if uncomfortable.
3. Higher oil revenues: Rising oil prices mean government revenues are far exceeding budget projections. These additional revenues may be directed toward other sectors (housing, education, healthcare) rather than direct fuel subsidies.
However, there are scenarios that could prompt intervention:
- If gasoline exceeds AED 4 per liter and remains there for several months
- If inflation rises sharply enough to threaten social stability
- If the commercial sector — particularly small businesses — sustains damage that threatens employment
In such cases, we might see measures such as a temporary price cap on commercial diesel, additional EV incentives, or direct support for the commercial transport sector.
Practical Tips to Reduce Your Fuel Bill
While waiting for prices to come back down — which may or may not happen soon — here are practical steps you can implement immediately:
1. Improve your driving style:
- Avoid sudden acceleration — it increases fuel consumption by 15-30%
- Maintain steady speeds on highways (100-110 km/h is the optimal range)
- Use cruise control whenever possible
- Turn off the engine during extended stops (more than one minute)
2. Vehicle maintenance:
- Correct tire pressure saves 3-5% on fuel consumption
- A clean air filter improves efficiency by 2-3%
- The right engine oil reduces friction and improves fuel economy
3. Smart planning:
- Combine errands into a single trip instead of multiple outings
- Use fuel price comparison apps (such as the ADNOC and EPPCO apps)
- Fill up in the morning when fuel is denser due to lower temperatures
- Carpool with colleagues for the daily commute
4. Transport alternatives:
- Dubai Metro — covers most major commercial and residential areas
- Public buses — extensive network at low cost
- E-scooters and e-bikes — excellent for short distances in equipped areas
- Remote work — negotiate one or two work-from-home days per week
5. Fueling strategy:
- Do not wait until the tank is empty — regular partial fills help manage cash flow
- Use loyalty cards (such as ADNOC Rewards) for discounts
- Some banks offer 3-5% cashback on fuel purchases through their credit cards
How Fuel Prices Affect the Dubai Real Estate Market
The connection between fuel prices and real estate may seem unlikely, but it is real. Rising commuting costs influence housing decisions in several ways:
Areas far from employment hubs: Neighborhoods like Jebel Ali, Dubai South, and Arabian Ranches — located far from major business districts — may see weakened rental demand as commuting costs rise. A driver covering 60 km daily (round trip) now pays approximately AED 400 more per month than someone living near their workplace.
Areas near metro stations: Properties close to metro stations may see increased demand as residents seek alternatives to private vehicles.
Commercial real estate: Companies that provide transport allowances to employees will feel mounting pressure, potentially prompting some to downsize office space or relocate to less expensive areas.
What Happens If the Crisis Continues? Scenarios for the Coming Months
The future of fuel prices is directly tied to developments in the Iran war and the Strait of Hormuz. Three main scenarios emerge:
Scenario 1 — Ceasefire (30% probability): If diplomatic efforts succeed in halting hostilities and fully reopening the Strait of Hormuz, oil prices could retreat to the $80-90 per barrel range within weeks. In this scenario, UAE fuel prices could return to AED 2.50-2.70 per liter levels by June or July 2026.
Scenario 2 — Continued tensions (45% probability): If the war continues at a similar pace without significant escalation or de-escalation, oil prices will remain elevated between $100-115 per barrel. UAE fuel prices would stay in the AED 3.00-3.50 per liter range with monthly fluctuations.
Scenario 3 — Major escalation (25% probability): If the conflict intensifies sharply — such as a complete closure of the Strait of Hormuz or targeting of major oil facilities — oil prices could spike above $130-150 per barrel. In this case, we could see gasoline prices exceeding AED 4 per liter in the UAE, which would almost certainly trigger government intervention.
The Bigger Lesson: The Fragility of Oil Dependence
April 2026’s fuel price surge delivers an important lesson about the complex relationship between Gulf states and oil. The UAE — OPEC’s third-largest producer — is experiencing a sharp rise in domestic fuel prices because of a crisis in a strait located just 200 kilometers from its shores.
This confirms that dependence on a single energy source — even if you are one of its largest producers — leaves you vulnerable to volatility beyond your control. The transition toward renewable energy and electric vehicles is not an environmental luxury — it is a strategic and economic necessity.
The UAE’s Clean Energy Strategy 2050 targets generating 50% of electricity from clean sources by 2050. The April 2026 crisis may prove to be the catalyst that accelerates this transition.
The Bottom Line: A New Reality Demanding Swift Adaptation
The 31-72% fuel price increase in April 2026 is not merely a temporary price fluctuation — it is a direct reflection of a major geopolitical crisis engulfing the entire region. Your monthly fuel bill has risen by approximately AED 100-400, and the price of everything from food to delivery to construction will be affected accordingly.
The bad news: there does not appear to be a quick fix on the horizon. The crisis is tied to a regional war whose duration and outcome remain unknown.
The good news: the UAE is a strong, diversified economy, and the government possesses substantial financial reserves to manage crises. UAE consumers have also demonstrated resilience and adaptability in the face of changing economic conditions.
In the meantime, focus on what you can control: drive efficiently, maintain your vehicle, explore public transit alternatives, and give serious consideration to an electric vehicle if you are planning to change cars within the next year or two. Every dirham saved on fuel is a dirham that can be invested elsewhere.