النقاط الرئيسية
- البيتكوين عند 68,014 دولار في مارس 2026، منخفضاً 15,460 دولاراً (18.5%) مقارنةً بالعام الماضي
- 400 مليون دولار تصفيات ضربت أسواق العملات المشفرة في 24 ساعة — 68% مراكز شراء، 32% مراكز بيع
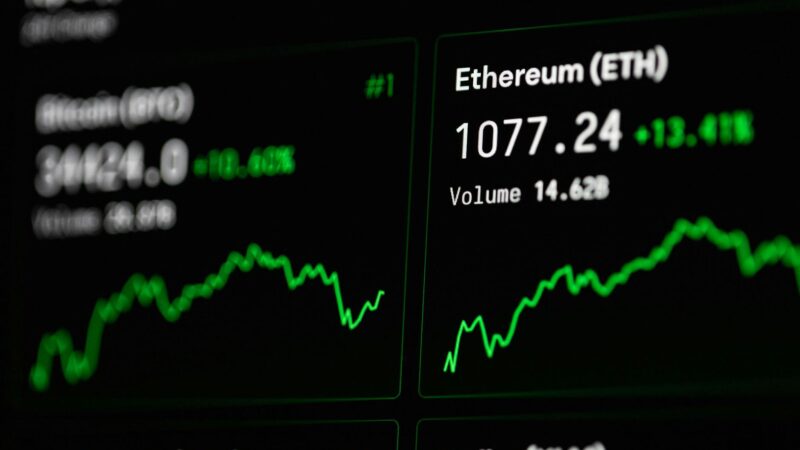
- القيمة السوقية الإجمالية: 2.33 تريليون دولار (-1.11% في 24 ساعة)، وهيمنة BTC عند 59.11%
- تداول العملات المشفرة في الشرق الأوسط ارتفع 85% على أساس سنوي في الربع الأول من 2026
- الذهب تفوّق على البيتكوين بـ31 نقطة مئوية منذ بداية الصراع الإيراني في مطلع مارس 2026
تراجع البيتكوين إلى 68,014 دولار في الأسبوع الثالث من مارس 2026 أعاد إحياء نقاش يُرافق العملات المشفرة في كل أزمة جيوسياسية كبرى: هل البيتكوين ذهب رقمي وملاذ آمن حقيقي، أم أنه أصل مرتفع البيتا يهبط جنباً إلى جنب مع ناسداك حين يلجأ المستثمرون المؤسسيون إلى النقد؟
بيانات مارس 2026 تقدّم إجابة واضحة، وإن كانت مزعجة لمتحمسي البيتكوين. منذ تصاعد أزمة هرمز الإيرانية في مطلع مارس — التي أدّت إلى ارتفاع برنت إلى 108 دولار/برميل ودفعت الذهب إلى مستويات قياسية فوق 3,200 دولار/أوقية — تراجع البيتكوين 11.2%. الذهب، في الفترة ذاتها، ارتفع 19.8%. التباين — 31 نقطة مئوية — هو أشرس اختبار واقعي لأطروحة البيتكوين-كالذهب منذ انهيار كوفيد في مارس 2020.
ما الذي أشعل تصفيات الـ400 مليون دولار؟
اتبعت شلالات التصفية البالغة 400 مليون دولار في 21-22 مارس 2026 النمط المعتاد في أسواق العملات المشفرة: انخفاض طفيف في السعر يُفعّل أوامر وقف الخسارة على مراكز الشراء بالرافعة المالية، مما يولّد بيعاً قسرياً، يولّد مزيداً من الانخفاض، يضرب الشريحة التالية من نقاط الإيقاف.

المحفّز المباشر: تراجع سعر BTC 3.8% في نافذة 90 دقيقة يوم 21 مارس، ناجم عن تضافر: جلسة تجنّب مخاطر في أسواق الأسهم الأمريكية (S&P 500 -1.4%)؛ وأنباء عن تمسّك الفيدرالي بتوجه “أعلى لفترة أطول”؛ وضغط بيع من محفظة مرتبطة بتوزيع دائني Mt. Gox.
من مجموع الـ400 مليون دولار المصفّاة:
• 272 مليون دولار (68%) مراكز شراء
• 128 مليون دولار (32%) مراكز بيع
• أكبر تصفية منفردة: مركز شراء BTC بـ18.4 مليون دولار على بايننس
• إيثيريوم أضاف 61 مليون دولار إضافية إلى الرقم الإجمالي
البيتكوين مقابل الذهب في حرب إيران: بطاقة الأداء
منذ تصاعد الصراع (خط أساس 4 مارس 2026):
• الذهب (XAUUSD): +19.8% (من 2,674 إلى 3,203 دولار/أوقية)
• برنت الخام: +28.4%
• مؤشر أسهم الدفاع الأمريكية: +14.2%
• البيتكوين (BTC): -11.2% (من 76,600 إلى 68,014 دولار)
• إيثيريوم (ETH): -14.7%
• ناسداك 100: -6.8%
راجع تحليلنا لـتوقعات الذهب لأبريل 2026 وأداء الملاذ الآمن للتحليل المكمّل.
كيف تؤثر حرب إيران على تداول العملات المشفرة في الشرق الأوسط؟
في مفارقة لافتة، بينما تراجع سعر البيتكوين بالدولار، ارتفعت أحجام تداول العملات المشفرة في الشرق الأوسط بشكل حاد. بيانات Chainalysis الإقليمية تُظهر أن معاملات العملات المشفرة في منطقة الشرق الأوسط وشمال أفريقيا في الربع الأول 2026 أعلى بـ85% مقارنةً بالربع الأول 2025. الدافع ليس المضاربة بل الأداة الوظيفية: حفظ رأس المال والتحويلات عبر الحدود.
العملات المستقرة — خاصةً USDT (تيثر) وUSDC — هي المستفيد الأكبر. ارتفعت أحجام العملات المستقرة في دول الخليج 120% على أساس سنوي في الـ12 شهراً حتى مارس 2026. للمزيد راجع تحليلنا عن تداول العملات المشفرة والعملات المستقرة في الشرق الأوسط 2026.
ما هو التوقع للبيتكوين حتى أبريل 2026؟
المقاييس على السلسلة تقدّم صورة مختلطة لكنها بنّاءة بشكل معتدل. مضاعف Puell عند 0.74 — مستوى مرتبط تاريخياً بمناطق التراكم لا بالتقييم المفرط. مؤشر MVRV Z عند 1.8، دون عتبة 3.0 التي تسبق تاريخياً التصحيحات الكبرى.
المقاومة الرئيسية: 72,500 دولار (المتوسط المتحرك لـ50 يوماً). الدعم الرئيسي: 64,800 دولار (المتوسط المتحرك لـ200 يوم). إغلاق دون 64,800 دولار بحجم كبير سيُشير تقنياً إلى تصحيح أعمق نحو 58,000 دولار.
أسئلة شائعة
لماذا انخفض البيتكوين بينما ارتفع الذهب خلال أزمة إيران؟
المستثمرون المؤسسيون والبنوك المركزية والرساميل المتجنّبة للمخاطر تلجأ إلى الذهب افتراضياً خلال الصدمات الجيوسياسية — مخزن قيمة عمره 5000 عام بلا مخاطر طرف مقابل. قاعدة مستثمري البيتكوين أصغر سناً وأكثر تقبّلاً للمخاطر؛ حين تنخفض شهية المؤسسات للمخاطرة، يتجاوز ضغط البيع على البيتكوين قوة الشراء. ارتباط BTC مع ناسداك يبلغ +0.71، بينما ارتباطه مع الذهب -0.18.
هل تعني التصفيات البالغة 400 مليون دولار انهياراً وشيكاً؟
لا بالضرورة. 400 مليون دولار تمثّل نحو 0.017% من إجمالي القيمة السوقية للعملات المشفرة — متواضعة بالقيمة المطلقة. الإجمالي الشهري لمارس 2026 البالغ 1.7 مليار دولار مرتفع مقارنةً بالأشهر العادية (400-600 مليون) لكنه أبعد ما يكون عن ذروة 2022 (5-8 مليارات شهرياً).
هل يجب على حاملي صناديق البيتكوين الأمريكية القلق؟
السياق مهم. البيتكوين عند 68,014 دولار في مارس 2026 لا يزال أعلى بكثير من مستويات ما قبل موافقة ETF (38,000 دولار في أواخر 2023). التراجع الحالي هو حركة تجنّب مخاطر مدفوعة جيوسياسياً لا انهياراً هيكلياً. المؤشرات على السلسلة لا تُشير إلى قاع استسلام بعد، لكن مستوى الدعم 64,800 دولار يستحق المتابعة الدقيقة.
ما دلالة هيمنة BTC عند 59.11% على مستثمري العملات البديلة؟
ارتفاع هيمنة البيتكوين سلبي عموماً للعملات البديلة في المدى القريب. الرساميل تتركّز في BTC كملاذ نسبي داخل منظومة العملات المشفرة. حصة إيثيريوم تقلّصت من 18.2% إلى 15.6%، وموسم العملات البديلة غير مرجّح حتى يستقر البيتكوين ويعود الإقبال على المخاطرة.