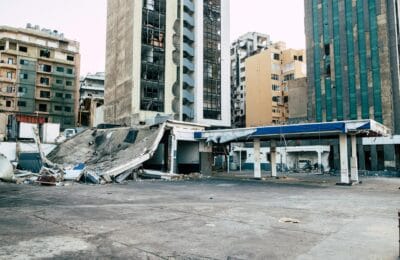
مضى 17 يومًا على إغلاق مضيق هرمز اعتبارًا من 17 مارس 2026 — وهو أطول إغلاق مستدام لأكثر نقاط الاختناق النفطي أهمية في العالم على مر التاريخ. أسفرت عملية “الغضب الملحمي” الأمريكية ضد البنية التحتية النووية والعسكرية الإيرانية عن سلسلة من التداعيات الاقتصادية تتخطى حدود ساحة المعركة. سقط 1,444 قتيلًا إيرانيًا في غارات جوية مؤكدة. بلغ برنت ذروة 120 دولارًا للبرميل. ارتفعت أسعار الغاز الأمريكي 24%. وقفز سعر الأسمدة 30%. وتُقدَّر تكلفة الاضطراب التراكمية للاقتصاد العالمي بـ200-300 مليار دولار — والعداد لا يزال يدور.
النقاط الرئيسية
- اليوم 17 من إغلاق هرمز — أطول اضطراب مستدام في تاريخ المضيق؛ 20% من إمدادات النفط العالمية متضررة
- 1,444 قتيلًا مؤكدًا في إيران — عملية “الغضب الملحمي” تستهدف المواقع النووية وبنية الحرس الثوري والصواريخ
- برنت بلغ ذروة 120 دولارًا والآن عند 102 دولار — علاوة حرب 15-20 دولارًا مدمجة في التسعير الراهن
- أسعار الغاز الأمريكي +24% منذ 1 مارس — المتوسط الوطني 3.70 دولار/غالون، يُكلّف الأسرة الأمريكية ~500 دولار إضافية سنويًا
- أسعار الأسمدة +30% — الغاز الطبيعي (مرتبط بصادرات قطر المغلقة) هو المادة الخام الرئيسية
- S&P أكدت تصنيفات دول الخليج: قطر AA، السعودية A+، الإمارات AA- — الائتمان السيادي مستقر
كم من النفط أخرج إغلاق هرمز فعليًا من السوق؟
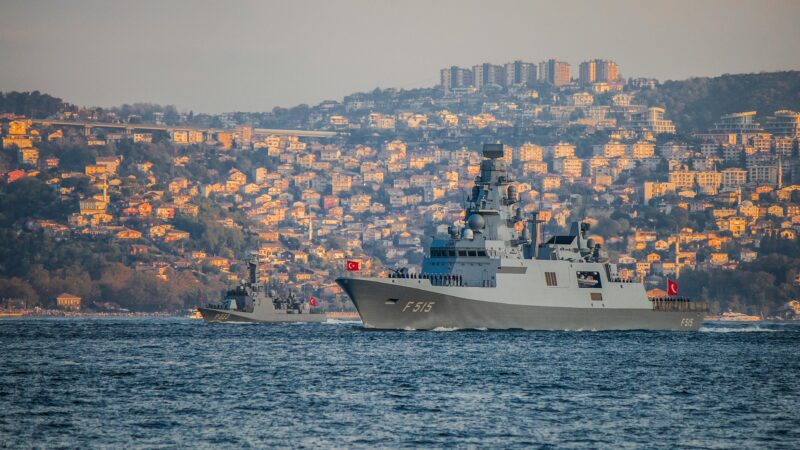
يبلغ مضيق هرمز في أضيق نقطة له 33 كيلومترًا، ويتولى عادةً تمرير نحو 20% من السوائل النفطية العالمية — ما يعادل تقريبًا 17 مليون برميل من النفط الخام يوميًا، فضلًا عن 3.5-4 مليارات قدم مكعبة من الغاز الطبيعي المسال. منذ إعلان الحرس الثوري الإيراني المضيق منطقة عسكرية في الأول من مارس، تراجعت حركة الناقلات التجارية إلى ما يقارب الصفر. سجّلت المنظمة البحرية الدولية 12 عبورًا تجاريًا فقط في أول 17 يومًا من مارس مقابل متوسط 85-100 عبور يوميًا قبل الأزمة.
جرى تعويض جزء من هذا النقص عبر: زيادة إنتاجية البترول السعودي إلى 3.5-4 ملايين برميل يوميًا، وتشغيل خط أنابيب أبوظبي بكامل طاقته 1.5 مليون برميل، وإطلاق 30 مليون برميل من الاحتياطي الاستراتيجي الأمريكي، و60 مليون برميل من إطلاق وكالة الطاقة الدولية المنسّق. ورغم هذه الإجراءات، يمتص السوق نقصًا صافيًا يتراوح بين 8-10 ملايين برميل يوميًا.

للاطلاع على آليات مسارات الأنابيب البديلة، راجع تحليلنا لـاضطراب شحن هرمز وتداعياته وكيف تؤثر حرب إيران على دول الخليج وأسعار النفط.
ماذا فعل إغلاق هرمز لأسعار الغاز الأمريكي وميزانيات الأسر؟
تمثّل زيادة 24% في أسعار الغاز الأمريكي — من متوسط ما قبل الحرب البالغ 2.98 دولار/غالون إلى 3.70 دولار — أحد أسرع الارتفاعات في تاريخ الغاز الأمريكي في أوقات السلم. للأسرة الأمريكية التي تستهلك نحو 1,100 غالون سنويًا، يضيف المستوى الراهن نحو 792 دولارًا سنويًا مقارنة بأسعار ما قبل الحرب. يرصد نموذج توقعات التضخم الفوري لبنك الاحتياطي الفيدرالي في كليفلاند 0.31 نقطة مئوية من مؤشر CPI لمارس المتوقع مباشرةً لانعكاسات أسعار الطاقة من إغلاق هرمز.
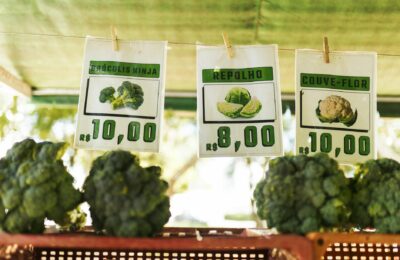
لماذا ارتفعت أسعار الأسمدة 30% وما انعكاسها على تكاليف الغذاء؟
يُعدّ ارتفاع سعر الأسمدة من أقل التداعيات الاقتصادية لإغلاق هرمز تغطيةً إعلاميةً — ومن أشدها أثرًا على الأسر ذات الدخل المحدود. تعمل آلية الانتقال عبر الغاز الطبيعي، لا النفط الخام.
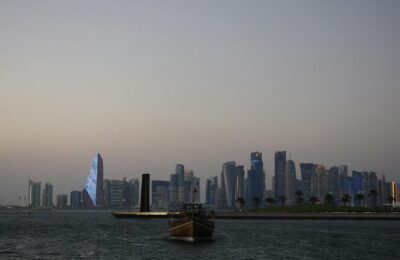
قطر هي أكبر مُصدِّر للغاز الطبيعي المسال عالميًا، وتوقفت صادراتها كليًا منذ 1 مارس. تُزوّد قطر عادةً 20-25% من تجارة الغاز المسال العالمية. أسفر ارتفاع أسعار الغاز المنجم عنه عن ارتفاع سعر الأمونيا من 350 دولارًا للطن المتري إلى 455 دولارًا — بزيادة 30%. لمزارعي الذرة والصويا الأمريكيين في موسم الزراعة الربيعية، تُضيف هذه الزيادة 15-25 دولارًا للفدان من تكاليف الإنتاج. وارتفعت عقود الذرة والصويا الآجلة بـ8-12% منذ 1 مارس.
كيف تصمد دول الخليج اقتصاديًا رغم قربها من رقعة الحرب؟
أكدت وكالة S&P في مارس 2026 التصنيفات السيادية لجميع دول الخليج الكبرى: قطر AA، والسعودية A+، والإمارات AA-، جميعها بنظرة مستقرة. استندت الوكالة إلى صناديق الثروة السيادية الضخمة (صندوق الاستثمارات العامة السعودية 900+ مليار دولار، أديا وأبوظبي الإماراتية 1.2 تريليون دولار مجتمعةً)، وعائدات نفطية فوق الميزانية عند برنت بـ100+ دولار. رغم ذلك، تراجع حركة مطار دبي الدولي 25-30% في أسبوعين، وتوسّعت فروق مقايضة مخاطر الائتمان السيادي للبحرين وعُمان بـ45-60 نقطة أساس.
ما تكلفة إعادة التوجيه التي يضيفها على التجارة العالمية؟
كل ناقلة مضطرة للإبحار حول رأس الرجاء الصالح تُضيف 10-14 يومًا لرحلتها نحو آسيا. بمعدل يومي للناقلات العملاقة يبلغ 60,000-80,000 دولار/يوم، يضيف ذلك 600,000-1.1 مليون دولار لكل رحلة. مع إعادة توجيه أكثر من 300 رحلة في أول 17 يومًا، تتجاوز تكلفة اضطراب طبقة الشحن 300 مليون دولار. وارتفعت أقساط التأمين ضد مخاطر الحرب للرحلات الخليجية 800-1,200%.
أسئلة شائعة
إلى متى قد يستمر إغلاق هرمز؟
يُشير التحليل التاريخي للنزاعات الجيوسياسية إلى أن الحلول تظهر عادةً خلال 30-60 يومًا للإغلاق الجزئي. تتراجع رافعة إيران الاقتصادية من الإغلاق بمرور الوقت مع تحسّن مسارات الأنابيب البديلة وإطلاق احتياطيات استراتيجية. معظم سيناريوهات المحللين تُسعّر حلًا جزئيًا — السماح ببعض العبور التجاري — خلال 30-45 يومًا من بدء النزاع، ما يضع نافذة إعادة الفتح الجزئي المحتملة في الأسبوعين الأولين من أبريل 2026.
ما هي عملية “الغضب الملحمي” وما أهدافها؟
عملية “الغضب الملحمي” هي الحملة العسكرية الأمريكية المنطلقة في 1 مارس 2026، وتستهدف البنية التحتية لبرنامج الأسلحة النووية الإيراني ومنشآت قيادة الحرس الثوري وقواعد إطلاق الصواريخ الباليستية. الهدف الأمريكي المُعلَن هو التدمير الدائم لقدرة إيران على اختراق العتبة النووية، لا تغيير النظام. شركاء التحالف: المملكة المتحدة وفرنسا وعدة دول خليجية توفّر قواعد وتقاسم استخباراتي.
كيف يؤثر ارتفاع سعر الأسمدة على أسعار البقالة الأمريكية؟
ينعكس ارتفاع سعر الأسمدة على أسعار البقالة الأمريكية بـتأخر يتراوح بين 6 و12 شهرًا. ترتفع تكاليف زراعة الذرة ربيع 2026 بـ15-25 دولارًا للفدان. الأثر الرئيسي سيظهر في تسعير محصول 2026، متأثرًا بأسعار الذرة والصويا والقمح والمنتجات المشتقة. يُتوقع أن يتجاوز تضخم البقالة لمنتجات البروتين في النصف الثاني من 2026 الخط القاعدي ما قبل الحرب بـ3-5%.
هل دول الخليج آمنة للاستثمار خلال الصراع مع إيران؟
تُشير تأكيدات S&P لمارس 2026 — قطر AA، السعودية A+، الإمارات AA- — إلى أن السيادات الخليجية تحتفظ بتصنيف استثماري بنظرة مستقرة رغم النزاع الإقليمي. جودة الائتمان السيادي محفوظة؛ الضغط متركّز في سندات شركات العقارات الإماراتية والأسهم المعتمدة على السياحة. لإطار الدخول المعدَّل بالمخاطر للأسهم، راجع دليل صناديق ETF للشرق الأوسط والأسهم.