Global oil stockpiles are the market’s shock absorbers, and in April 2026 they are telling a clear story: the system has recovered from the 2020-2022 drawdown cycle but not fully. The US Strategic Petroleum Reserve stands at 373 million barrels, well below its pre-2022 level of 714 million but climbing steadily. OECD commercial inventories are at 2,890 million barrels, near the five-year average. Chinese strategic reserves are expanding but opaque. China’s commercial inventory build has been significant. This article maps where the world’s oil stocks actually sit and what the numbers mean for prices and security.
Oil inventory data is released continuously across multiple sources. EIA’s petroleum page provides comprehensive US data including weekly commercial inventories and SPR levels. Monthly reports from OPEC cover global stocks. Reuters energy reporting at reuters.com/business/energy and Bloomberg energy markets at bloomberg.com/markets/commodities/energy track changes in real-time. FT commodities provides institutional perspective on what inventory changes mean for markets.
The US Strategic Petroleum Reserve Story
The SPR’s 2022-2023 release of 180 million barrels was the largest in its history, ordered by President Biden as part of the response to Russia’s invasion of Ukraine and subsequent price spikes. The release was controversial. Supporters argued it eased consumer prices during a vulnerable period. Critics argued it politicized strategic reserves and reduced US crisis preparedness. The facts: Brent averaged $110/barrel in Q2 2022 when releases were strongest, versus estimates that absent releases it would have reached $125-130/barrel. The release demonstrably worked in its immediate objective of price moderation.

Since late 2023, the SPR has been slowly refilling. The Department of Energy has purchased roughly 150 million barrels at an average cost of $76/barrel, buying when WTI is below $80. The current 373 million barrels represents roughly 22 days of US net imports at current rates, down from the pre-2022 peak of 39 days. Full refill to pre-release levels requires approximately $30 billion in additional purchases at current prices and is not expected to complete before 2028.
The strategic question for the US is whether 373 million barrels is sufficient or whether a larger SPR is needed in the new geopolitical environment. Critics of the drawdown argue that Russian-Chinese axis confrontation requires larger US reserves. Supporters of the current level argue that US oil production resilience (currently 13.4 million barrels per day) reduces SPR strategic importance. The Biden administration shifted some SPR purchasing to smaller quantities and higher cost thresholds; the 2024 election outcome may affect future buying strategy.
The SPR release also created specific operational lessons. Release speed proved slower than theoretical maximum. Storage site maintenance has required modest investment during the refill period. The quality of purchased barrels has been slightly lower than original SPR crude due to market conditions during buying periods. These operational realities inform assessments of how useful the SPR would be in a genuine crisis scenario rather than a price-management scenario.
OECD Commercial Inventories
OECD commercial inventories totaled 2,890 million barrels at end-2025, compared to the 5-year average of 2,920 million. This is a modest deficit that reflects generally tight supply-demand balance through 2024-2025. The sub-average level has been a supporting factor for crude prices, preventing the kind of glut-induced price collapses that occurred in 2014-2016 and 2020.
The geographic distribution matters. US commercial stocks are roughly 840 million barrels, near average. European inventories are 930 million barrels, below average due to accelerated replacement of Russian crude flows. Japanese stocks are 450 million barrels, above average reflecting strategic hoarding after 2022 shocks. Korean stocks at 140 million are normal. Australian and New Zealand stocks at 90 million are normal.
The trajectory through 2026 is expected to be gradual build as demand growth slows relative to supply capacity. If OPEC+ maintains current policy, inventories should build 50-100 million barrels through 2026, approaching the 5-year average. This would remove the inventory-based price support and potentially soften prices.
The historical context matters. 2015-2016 saw OECD inventories peak at 3,100 million barrels, creating severe oversupply that collapsed prices to $30/barrel. 2019 saw stocks at 2,900 million, similar to current. 2020 saw COVID-related demand collapse push stocks to 3,200 million briefly. 2022-2023 saw rapid drawdown to 2,700 million during the Ukraine crisis. The current 2,890 million is historically normal and sustainable.
Chinese Strategic Petroleum Reserves
China’s strategic reserves are deliberately opaque but estimated to hold approximately 900 million barrels, making them the world’s largest. The reserve has been built over the past 15 years through periodic purchases, often when prices were low. China added substantially to reserves during 2020-2022 price weakness and has maintained buying through 2024-2025 despite higher prices.
The strategic purpose of Chinese reserves is energy security during geopolitical tension. Chinese oil imports are roughly 11.5 million barrels per day, making China the world’s largest oil importer. Vulnerabilities include maritime supply disruption in the Strait of Hormuz or Malacca, export restrictions by major suppliers, or pricing shocks. Chinese reserves provide roughly 90 days of import coverage, exceeding US SPR coverage.
Chinese reserve data is published irregularly through customs statistics and industrial reporting. Analyst estimates synthesize available data but uncertainty remains. The trajectory appears to be gradual expansion of strategic reserves while commercial reserves fluctuate with short-term demand. China’s domestic production of roughly 3.9 million barrels per day reduces net import dependence but remains constrained by geology.
Saudi Arabia and UAE Inventory Strategies
Saudi Arabia maintains substantial domestic oil inventories including crude in floating storage, refinery feedstock storage, and in-ground reserves. These provide operational flexibility but serve less strategic reserve purpose given Saudi spare capacity. Saudi Arabia’s 3 million barrels per day spare capacity is effectively a dynamic inventory — barrels that can be added to market within weeks rather than pumped from storage.
UAE strategic inventories are managed by ADNOC and include crude stored in refinery complexes and in-ground reserves managed for operational flexibility. UAE’s strategy emphasizes production flexibility rather than passive storage. The 5 million barrels per day capacity target by 2027 creates substantial production optionality.
The Gulf producer approach differs fundamentally from consumer countries. Consumer countries like the US, Europe, and China maintain stored barrels for security. Producer countries like Saudi Arabia and UAE maintain production capacity as their effective security reserve. The two approaches serve different security objectives.
How Inventory Data Affects Prices
Inventory changes are one of the most reliable short-term price indicators in oil markets. Weekly US commercial inventory changes typically produce 1-3% price movements in crude benchmarks. Monthly OECD changes produce 2-5% movements. Surprises (inventory changes of more than 2 standard deviations from expectations) produce larger movements.
The market psychology around inventories reflects real supply-demand information. Inventory builds above normal seasonal patterns signal either demand weakness or supply strength. Inventory draws below normal signal tightness. These signals inform trader positioning and become self-reinforcing in price dynamics.
Algorithmic trading has increased the speed of inventory-to-price reactions. Where news coverage would traditionally drive response over hours to days, algorithmic trading now moves prices within minutes of data release. This creates opportunities for traders with better data access but reduces the informational role of inventory for longer-horizon decisions.
The inventory-price relationship is complex rather than simple. When inventories are already above average, additional builds have smaller price impact. When inventories are at critically low levels (as in early 2022 OECD stocks), inventory changes drive larger price movements. The interaction with OPEC+ signaling, geopolitical events, and demand surprises creates the actual price trajectory.
Reserve Use in Historical Crises
Strategic reserves have been used in several major episodes. The 1979 Iranian revolution triggered the first coordinated IEA member release. The 1991 Gulf War produced another coordinated release. Hurricane Katrina in 2005 triggered US SPR use. The 2011 Libyan civil war led to IEA coordinated releases. The 2022 Russian invasion of Ukraine triggered the largest release in history.
Each release has been controversial at the time and illuminating in hindsight. Releases in response to supply disruptions (Iran, Libya, Katrina) were relatively uncontroversial and effective. Releases in response to price movements (2022) generated more debate about whether strategic reserves should serve price-management rather than supply-security functions.
The effectiveness varies. The 2022 release measurably moderated prices but cost $30+ billion in market-below-average purchase recovery. The 1990-91 releases effectively countered Saddam-era disruption. Hurricane Katrina releases provided genuine supply bridging. Libya releases were somewhat delayed relative to the actual supply impact. These historical experiences inform strategic reserve policy debates.
Investment Implications of Current Stock Levels
For investors, inventory levels affect several specific positioning questions. Fair value for crude benchmarks reflects current inventory context. Brent at $80/barrel with inventories 30 million below 5-year average is different from Brent at $80/barrel with inventories 150 million above average. The inventory context matters for fundamental value assessment.
Short-dated crude contract risk-reward depends on inventory trajectory. Tight inventories support short-dated prices against long-dated. The current shape of the crude curve (roughly flat to modest backwardation) reflects the current inventory backdrop. Sharper backwardation would signal tighter inventories; contango would signal inventory surplus.
Refiner margin dynamics depend on product inventories as well. US gasoline inventories at seasonal norms provide pricing support. Distillate inventories below norms create margin pressure upside. These product inventory dynamics shape refiner stock performance independent of crude prices.
Pipeline and storage asset valuations depend on inventory fill rates. Companies like Enterprise Products Partners, Energy Transfer, and Plains All American generate revenue based on pipeline and storage utilization. Higher inventories generally support better utilization. Sustained low inventories (as in 2022) create margin pressure.
Strategic Reserves and Energy Transition
Energy transition creates complex questions for strategic reserves. If oil demand peaks and declines through the 2030s, strategic reserves become less useful over time. However, transition itself may create volatility that makes reserves more useful in the near term. The net effect is unclear.
The US approach has been to maintain SPR at roughly 50% of pre-2022 levels while shifting toward market-based supply security rather than passive storage. The European approach has been more varied, with some countries expanding strategic inventories while others (UK, Norway) maintain minimal reserves given domestic production.
The Chinese approach appears to be continued expansion of both strategic and commercial reserves given import dependence and geopolitical tension. The Japanese approach prioritizes strategic reserve maintenance given minimal domestic production. The Korean approach is similar. These differing national approaches create diverse global inventory dynamics.
Related Middle East Insider Coverage
For price forecast context, see our Brent Q2 2026 forecast and global oil demand 2030 forecast. Our OPEC May 2026 meeting preview and peak oil 2026 analysis provide the policy and long-term context. For historical price context, see oil price history 2020-2026.
Future Stock Policy Directions
Several specific policy debates are active on strategic reserves. The question of SPR size — whether 373 million is sufficient or whether higher levels are needed — remains unresolved. The question of SPR purpose — supply security versus price management — has been implicitly resolved through recent use but remains philosophically contested. The question of international coordination — whether IEA member release coordination remains effective — has been tested successfully in 2022.
Climate policy creates additional dimensions. Some advocates argue for reducing strategic reserves as transition progresses. Others argue for maintaining or expanding reserves as transition may increase volatility. Biofuel and hydrogen reserves are being discussed in some jurisdictions. These policy conversations will shape reserve evolution through the 2030s.
Private sector stockpiling is an underappreciated component of total strategic reserves. Major oil companies maintain inventories for operational reasons. Traders maintain inventories for arbitrage. Refiners maintain feedstock stocks. The total of these private inventories is roughly 2,000 million barrels globally, larger than combined strategic reserves. Regulatory or tax policy changes affecting these private inventories would have significant market implications.
Assessing Stock Levels in Real Time
For readers wanting to track inventory developments, several specific data sources matter. EIA’s weekly petroleum status report (Wednesdays at 10:30 AM ET) provides the most reliable US data. API’s weekly report (Tuesday evenings) provides earlier but less accurate preview. JODI monthly data provides international context. Platts, Argus, and Rystad provide commercial data services with additional detail for professional users.
The key metrics to watch are: weekly US commercial crude stocks change versus 5-year average; weekly US gasoline stocks change; Cushing inventory (key pricing point for WTI); product inventories; and change in SPR. Monthly metrics include OECD commercial stocks total, days of forward cover (stocks divided by daily consumption), and regional inventory patterns.
Professional market analysts often track more granular data including specific grade inventories, floating storage, and pipeline fill levels. These provide earlier signals of inventory trends but require specialized data sources. Retail readers can generally get 80% of actionable information from freely available EIA and OPEC reports.
Global Inventory System Resilience
The total global oil inventory system — strategic reserves, commercial reserves, private sector stocks — totals roughly 5,000 million barrels or 48 days of global demand. This is substantial buffering against short-term disruption but modest against sustained supply shock. Historical maximum drawdown during 1973-74 crisis reduced usable reserves by approximately 30%. Modern crisis scenarios could theoretically produce similar drawdown.
The system has demonstrated resilience during 2022 testing. The Russian invasion of Ukraine forced meaningful inventory drawdown but didn’t collapse the system. Prices rose but supplies remained available. This real-world stress test demonstrated that the combined global inventory system can absorb significant shocks without systemic failure.
Looking forward, the inventory system faces several specific challenges. Strategic reserve replenishment from 2022 depletion remains incomplete. Transition pressure may reduce incentive for private sector stockpiling. Geopolitical fragmentation may reduce IEA coordination effectiveness. These challenges require policy response but don’t fundamentally threaten system viability.
Regional Inventory Deep Dive
Looking deeper into regional inventory patterns reveals meaningful variation across markets. US inventories at 840 million barrels span multiple categories. Commercial crude oil at roughly 430 million barrels. Cushing specifically at 28 million barrels (an important pricing point). Gasoline at 235 million barrels. Distillate fuel oil at 115 million barrels. Propane at 60 million barrels. Each has distinct pricing implications and seasonal patterns.
The Cushing, Oklahoma inventory is particularly important because it’s the physical delivery point for WTI crude futures. When Cushing stocks are low (below 20 million barrels), WTI can trade at premium to other Gulf crude. When Cushing is above 40 million barrels, WTI typically trades at discount. Current 28 million is middle-of-range and relatively neutral for WTI pricing.
European inventories face different dynamics after the 2022 shift away from Russian crude. The IEA’s stock obligation (requiring members to hold 90 days of net imports) was tested during 2022 releases and has since been fully replenished. Current inventory adequacy is supported by diversified sourcing including US exports, Guyana, Brazil, Middle East flows, and West African crude.
Japanese inventories reflect Japan’s minimal domestic production and high import dependence. Private sector stocks supplement government strategic reserves. Total Japanese oil stocks equivalent to 170 days of consumption represents the highest coverage among major OECD economies. This reflects Japan’s acute awareness of energy security post-Fukushima.
South Korean inventories follow a similar pattern with roughly 130 days of consumption coverage. Australian and New Zealand stocks are lower at 50-70 days coverage reflecting continuing dependence on imported refined products even as their own oil production declines.
The Economics of Strategic Reserve Management
Strategic reserve management involves several specific economic considerations. First, the opportunity cost of holding oil rather than deploying capital elsewhere. At current interest rates, 373 million barrels of SPR represents about $3-4 billion in annual opportunity cost. This is a real cost that must be weighed against security benefits.
Second, the storage costs. The five US SPR facilities (West Hackberry, Big Hill, Bryan Mound in Texas; Bayou Choctaw in Louisiana; Weeks Island in Louisiana) have meaningful maintenance costs. Annual operating budget is roughly $300-400 million. Major refurbishment cycles add periodic large expenditures. Total all-in annual cost including interest is approximately $2 billion.
Third, the quality management. Strategic reserves store sweet and sour crude in specific proportions to match domestic refinery capabilities. The current SPR is roughly 60% sour and 40% sweet crude. This matches US refinery configuration. Over time, quality drifts require monitoring and occasionally product exchanges.
Fourth, the commercial value. When drawn down, SPR crude is sold at market prices. During 2022 releases, the crude was sold at roughly $90-100 per barrel. Subsequent refill purchases averaged $76. The net financial result of the 2022 release-refill cycle has been favorable to the US Treasury, though exact calculations depend on assumed counterfactuals.
Release Mechanisms and Decision Frameworks
Strategic reserve releases require specific triggering events and authorization processes. In the US, SPR release authority rests with the President under the Energy Policy and Conservation Act. The 2022 releases were executed through announced milestones rather than emergency declarations. Previous releases under Clinton, George W. Bush, and Obama followed similar authorization patterns.
IEA coordinated releases require member nation agreement through the IEA coordinated action mechanism. The 1979, 1991, 2011, and 2022 coordinated actions involved multiple members with release volumes proportional to their strategic reserve size. This coordination is managed through IEA’s Industry Advisory Board and member country energy ministries.
The decision frameworks for release have evolved. Prior to 2022, reserves were generally seen as last resort for catastrophic supply disruption. The 2022 release signaled willingness to use reserves for significant but not catastrophic disruptions. Future releases may occur at lower thresholds of disruption, or alternatively, may be reserved more carefully for truly extreme scenarios.
The public communication around release decisions has also evolved. The 2022 releases were announced with specific volumes and timelines. Market reaction was managed through this clarity. Previous releases were often less transparent about specific volumes until after execution. This transparency shift has implications for future releases.
Product Inventories and Refining Dynamics
While crude inventories get most attention, refined product inventories significantly affect pricing and market dynamics. US gasoline stocks at 235 million barrels provide insight into fuel market tightness. When stocks are below 210 million barrels heading into summer driving season, gasoline prices typically spike. Current inventory at 235 million provides modest buffer heading into 2026 summer peak demand.
Distillate inventories (diesel, heating oil, jet fuel blending components) at 115 million barrels are below the 5-year average. This tightness has supported distillate cracks and benefited refiners with high distillate yields. The structural shift in demand away from diesel use in road transport is partially offset by continued growth in shipping and aviation applications.
Jet fuel inventories reflect the aviation recovery post-COVID. Current US jet fuel stocks at 45 million barrels are near historical norms, supporting stable airline operations. European jet fuel inventories have been tighter due to Russia sanctions limiting previous supply routes. Asian jet fuel dynamics reflect rising domestic demand.
Petrochemical feedstock inventories (naphtha, LPG components) track petrochemical plant operations. Rising petrochemical demand globally has kept these inventories relatively tight. Saudi Arabia and UAE petrochemical investments contribute meaningfully to regional feedstock balance.
Residual fuel oil inventories have declined structurally as IMO 2020 regulations reduced marine demand for high-sulfur fuel oil. Current inventories are lower than pre-2020 patterns but adequate for remaining demand. The shift to VLSFO (very low sulfur fuel oil) and marine gasoil has changed inventory composition meaningfully.
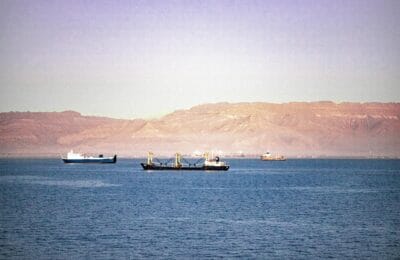
Tanker Fleet and Floating Storage
Beyond shore-based inventory, the global tanker fleet and floating storage represent additional buffering capacity. Roughly 80 million barrels of crude oil are in floating storage at any given time, including tankers waiting to unload and vessels being used for arbitrage storage. This is down from peak levels during 2020 demand collapse when 200+ million barrels were in floating storage.
VLCC tanker rates reflect storage economics. When rates are low, floating storage is economic. When rates are high, storage costs push oil to shore terminals. Current rates at roughly $45,000 per day per VLCC support moderate floating storage levels. This is well below 2020 peaks above $200,000 per day but also above 2021-2022 lows.
The geopolitical impact of tanker logistics is significant. Red Sea disruptions since 2023 have forced meaningful tanker rerouting, with vessels avoiding Suez transit taking longer voyages around Africa. This has increased effective storage (barrels in transit) while also increasing tanker utilization and rates.
Chinese Inventory Dynamics in Detail
Chinese inventory behavior deserves deeper examination given its global importance. The country has consistently built strategic reserves when prices were low. 2020 Q2 was a major buying period — Chinese imports peaked at 13 million barrels per day that quarter compared to demand of 12 million. The difference went to inventory.
Similar patterns emerged in 2016 and 2019-2020. Chinese reserves appear managed with a counter-cyclical buying strategy that smooths out price cycles. Import statistics show Chinese imports often exceed domestic demand by 1-2 million barrels per day during price lows, consistent with inventory building.
Commercial Chinese inventories at refineries and terminals add to strategic reserves. Total Chinese oil stocks at roughly 1,400 million barrels provide substantial buffering against disruption. This buffering capacity is an underappreciated stabilizer for global oil markets.
The opacity of Chinese data means market analysts must triangulate from customs statistics, refining runs, and reported demand. Reuters and Bloomberg track these data points continuously. The resulting estimates have improved over time but retain significant uncertainty bands.
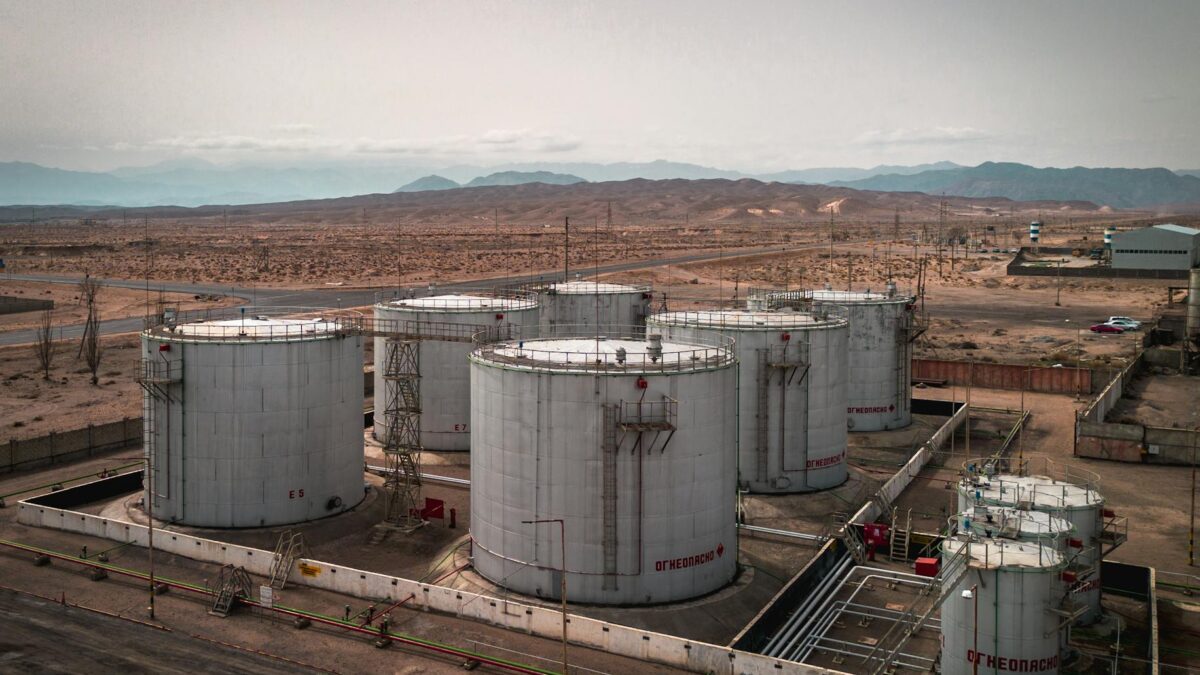
Middle East Producer Storage Strategies
Middle East producers maintain domestic oil storage with specific strategic purposes. Saudi Arabia’s Ras Tanura and Yanbu complexes contain substantial crude and product storage. UAE’s Fujairah has grown into a major storage hub serving both domestic needs and international trading. Kuwait maintains storage integrated with its export infrastructure.
These facilities serve operational flexibility more than strategic reserve. Saudi Arabia can ship crude on short notice using existing inventory, reducing the need for large strategic reserves. UAE’s Fujairah location outside the Strait of Hormuz provides alternative export routing in crisis scenarios. Kuwait’s integrated storage supports direct export capability.
Recent investments in Middle East storage include expansions at Fujairah, new capacity at Saudi Aramco’s Jafurah field, and UAE ADNOC storage expansions. Total regional crude storage capacity is approximately 400 million barrels with substantial spare capacity for further expansion if needed.
The strategic value of Middle East storage is primarily operational rather than security-related. Consumer country strategic reserves serve security functions. Producer country storage serves operational functions. The distinction matters for policy and investment analysis.
Looking Forward
Strategic reserve policy through 2030 will be shaped by several specific trends. Demand peak uncertainty creates reserve policy uncertainty. If peak arrives early, reserves become less useful over time. If peak is delayed, reserves remain valuable. Policy makers must balance these competing signals while maintaining operational capability.
International cooperation on reserves has evolved through 2022 testing. The IEA coordinated release framework demonstrated continued effectiveness. Cooperation between China and Russia on strategic supply has emerged but remains informal. The fragmentation of global oil markets into US-aligned and China-aligned blocs creates new coordination challenges that will shape reserve policy through 2030.
Technology continues to improve inventory monitoring and management. Satellite imaging of storage levels, blockchain-based custody tracking, and real-time data integration are all developing. These improvements reduce information asymmetries and enable more responsive reserve management.
For readers following these developments, ongoing monitoring of EIA weekly reports, OPEC monthly reports, and major energy news sources is the basic toolkit. Professional analysts layer commercial data services (Rystad, Wood Mackenzie, Platts Insight) on top. This combination provides comprehensive coverage of inventory dynamics across global markets.
The Bottom Line
Global oil inventories in April 2026 are adequate but not excessive. The US SPR at 373 million barrels is refilling from 2022 release. OECD commercial inventories at 2,890 million are near 5-year average. Chinese strategic reserves continue expanding. The combined system provides real but finite buffering against supply shocks.
For investors, current inventory levels support moderate crude prices without creating inventory-based downside. The gradual inventory build expected through 2026 could soften prices but doesn’t threaten a collapse. The inventory situation is generally supportive of current $70-85 Brent trading range.
For policymakers, the inventory system requires continued attention but is not in crisis. SPR replenishment continues. International coordination mechanisms remain in place. Private sector stockpiling continues. Strategic reserve policy debates are active but tractable.
The inventory system’s role in the energy transition remains to be defined. Continued moderate-level stockpiling supports stability during transition. Reduced stockpiling creates vulnerability. Increased stockpiling provides security but requires investment. The specific policy choices through 2028-2030 will shape the system’s trajectory through the 2030s.