آخر تحديث: 2 أبريل 2026
برنت عند 110 دولارات للبرميل. العناوين تصرخ بالأزمة. أسهم الطاقة ترتفع. محطات الوقود ترفع الأسعار. الجميع من محللي CNBC إلى سائقي التاكسي لديه رأي حول لماذا سيصل النفط إلى 150 دولاراً.
لكنهم جميعاً ينظرون إلى البيانات الخاطئة.

مدفوناً في آخر تقرير لـ وكالة الطاقة الدولية رقم يجب أن يرعب كل متفائل بالنفط: 3.8 مليون برميل يومياً من الفائض الضمني في النصف الثاني من 2026 — بمجرد انتهاء اضطراب مضيق هرمز. هذا ليس خطأ مطبعياً. إنه أكبر فائض متوقع منذ انهيار الجائحة في 2020. ولا أحد تقريباً يتحدث عنه.
يحلل هذا المقال لماذا نفط 110 دولارات هو فخ، ومن يستفيد من الوهم، وماذا يحدث لمحفظتك عندما تتبخر علاوة الحرب.
علاوة الحرب: كم منها حقيقي؟
قبل بدء حرب إيران في 27 فبراير 2026، كان خام برنت يتداول عند 76 دولاراً للبرميل. اليوم فوق 110 دولارات. هذه الزيادة البالغة 34 دولاراً تنقسم إلى مكونين:
| المكوّن | العلاوة المقدّرة | المدة |
|---|---|---|
| اضطراب الإمداد الفعلي (هرمز مغلق 90-95%) | 15-20 $/برميل | حتى إعادة فتح هرمز |
| علاوة المضاربة الحربية (الخوف من التصعيد) | 10-15 $/برميل | حتى وقف إطلاق نار موثوق |
| تحول أساسي (نمو الطلب الفعلي) | 2-4 $/برميل | هيكلي |
الاستنتاج الحاسم: فقط 2-4 دولارات من الزيادة البالغة 34 دولاراً تعكس أساسيات حقيقية. الباقي — أكثر من 85% من الارتفاع — هو علاوة مؤقتة تختفي لحظة ظهور وقف إطلاق نار موثوق أو إعادة فتح هرمز جزئياً.
قنبلة وكالة الطاقة الدولية: 3.8 مليون برميل يومياً فائض
يحتوي تقرير سوق النفط لشهر مارس 2026 الصادر عن وكالة الطاقة الدولية على توقع دفنته معظم وسائل الإعلام في الفقرة 47: بمجرد تطبيع الاضطرابات الحالية، يواجه سوق النفط العالمي فائضاً ضمنياً بـ 3.8 مليون برميل يومياً في النصف الثاني من 2026.
إليكم كيف تعمل الحسبة:
| العامل | برميل/يوم |
|---|---|
| نمو الطلب العالمي 2026 (تقدير IEA) | +1.05 مليون |
| نمو الإمداد من خارج أوبك (أمريكا، البرازيل، غيانا) | +1.8 مليون |
| زيادات إنتاج أوبك+ المخططة | +0.6 مليون (سنوياً) |
| عودة صادرات الخليج بعد هرمز | +3.0 مليون (مغلقة حالياً) |
| صافي الفائض الضمني | ~3.8 مليون |
للتوضيح: الفائض الذي أسقط أسعار النفط إلى سالب 37 دولاراً في أبريل 2020 كان نحو 25-30 مليون برميل يومياً — لكن ذلك كان شذوذاً لأسبوع واحد خلال إغلاق عالمي. فائض مستمر بـ 3.8 مليون سيدفع برنت تحت 70 دولاراً خلال أشهر.
أفادت وول ستريت جورنال أن بيوت التداول الكبرى — فيتول وترافيغورا وغونفور — تتموضع بالفعل للانعكاس، تبني مراكز بيع على المكشوف في المنحنى الآجل تراهن على 75 دولاراً لبرنت بحلول الربع الرابع 2026.
ماذا تقول البنوك فعلاً (خلف الأبواب المغلقة)
توقعات وول ستريت العلنية ومواقف تداولها الفعلية تروي قصتين مختلفتين:
| البنك | التوقع العلني | موقف التداول | ماذا يخبرك |
|---|---|---|---|
| جي بي مورغان | برنت يتوسط 110$ حتى أبريل | بيع صافي في عقود الربع 3-4 | يتوقعون الانهيار، ليس بعد |
| غولدمان ساكس | ‘رفع حاد’ لتوقعات 2026 | زيادة التحوط بالخيارات | عنوان متفائل، واقع متحوّط |
| مورغان ستانلي | نطاق 95-105$ | أكثر البنوك تشاؤماً | يعلن الفائض صراحة |
النمط واضح: كل مؤسسة كبرى تتوقع انخفاضاً كبيراً للنفط في النصف الثاني 2026. الخلاف فقط حول التوقيت — متى، وليس هل.
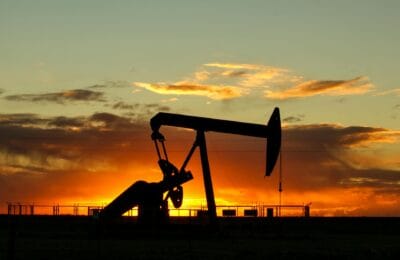
لماذا لا تستطيع أوبك إنقاذ السوق هذه المرة
1. نمو الإمداد من خارج أوبك أسرع مما يمكن لأوبك خفضه
إنتاج النفط الصخري الأمريكي من المتوقع أن يضيف 800,000 برميل يومياً في 2026. حقول البرازيل تضيف 400,000. حقل ستاروك في غيانا يضيف 300,000. نمو إجمالي من خارج أوبك بـ 1.8 مليون برميل يومياً يعني أن أوبك ستحتاج لخفض أكثر من ذلك فقط لموازنة السوق.
2. التزام أوبك+ يتصدع
العراق وكازاخستان تجاوزتا حصصهما مراراً. الإمارات ضغطت لرفع خط الأساس. قدرة روسيا على الخفض مقيّدة بالعقوبات. الجبهة الموحدة التي حافظت على 1.65 مليون برميل يومياً من التخفيضات الطوعية تُظهر تشققات.
3. الحسابات الاستراتيجية السعودية تغيّرت
نقطة التعادل المالي للمملكة نحو 80 دولاراً/برميل. عند 110 دولارات تحقق السعودية فوائض ضخمة تمول رؤية 2030. لكن القيادة تعرف أيضاً أن الأسعار المرتفعة المستمرة تسرّع التحول في الطاقة — كل سنة فوق 100 دولار هي سنة تكسب فيها الطاقة الشمسية والرياح والسيارات الكهربائية أرضاً.
جدول هرمز الزمني: متى تتبخر العلاوة؟
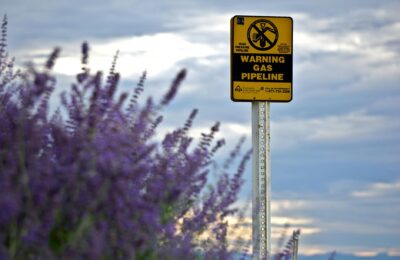
تعتمد علاوة الحرب كلياً على بقاء مضيق هرمز مغلقاً فعلياً. الوضع الحالي:
- حركة الشحن انخفضت 90-95% منذ 28 فبراير
- الحرس الثوري يشغّل نظام ‘كشك رسوم’ — 2 مليون دولار لكل عبور باليوان
- 2,000 سفينة و20,000+ بحّار عالقون
- باكستان حصلت على صفقة عبور محدودة لـ 20 سفينة
لكن المشهد الدبلوماسي يتحوّل. أفادت بلومبرغ أن مفاوضات القنوات الخلفية بين إيران والولايات المتحدة (عبر عُمان) تتقدم نحو اتفاق ‘ممر شحن’ يسمح بعبور محدود للنفط. إذا استُؤنف حتى 30-40% من حركة هرمز الطبيعية، فإن علاوة اضطراب الإمداد الفعلي (15-20 دولاراً) ستنخفض للنصف فوراً.
ماذا يعني هذا لاقتصادات الخليج
المكاسب (قصيرة الأجل)
فائض السعودية المالي عند نفط 110 دولارات يتجاوز 30 مليار دولار سنوياً. الإمارات والكويت وقطر تستفيد بالمثل. هذا يموّل كل شيء من نيوم إلى استثمارات صناديق الثروة السيادية.
المخاطر (متوسطة الأجل)
إذا انهارت الأسعار إلى 75 دولاراً عند إعادة فتح هرمز، ستنتقل السعودية من فائض إلى عجز خلال ربع واحد. مشاريع رؤية 2030 الضخمة — التي تعاني أصلاً من ضغط الميزانية مع إعادة هيكلة نيوم — قد تواجه مزيداً من التخفيضات.
كيف تموضع محفظتك
على المدى القصير (أبريل-يونيو)
علاوة الحرب لن تتبخر غداً. طالما بقي هرمز مغلقاً إلى حد كبير، يبقى النفط فوق 100 دولار. لكن هذه صفقة تداول وليست استثماراً.
على المدى المتوسط (النصف الثاني 2026)
ابدأ بتقليل تعرضك للنفط الآن. الإجماع بين البنوك الكبرى أن برنت ينخفض إلى 70-85 دولاراً بحلول الربع الرابع 2026.
على المدى الطويل (2027+)
التحول العالمي في الطاقة يتسارع. إضافات الطاقة الشمسية في 2025 تجاوزت جميع إضافات الوقود الأحفوري مجتمعة لأول مرة. مبيعات السيارات الكهربائية تجاوزت 20% من مبيعات السيارات العالمية. كل ارتفاع في النفط يسرّع التحول.
الأسئلة الشائعة
هل أسعار النفط مبالغ فيها في 2026؟
وفقاً لبيانات وكالة الطاقة الدولية، هناك فائض ضمني بـ 3.8 مليون برميل يومياً بمجرد انتهاء اضطرابات هرمز. سعر 110 دولار الحالي يتضمن علاوة حرب بـ 15-25 دولاراً.
ماذا يحدث لأسعار النفط عند إعادة فتح هرمز؟
محللون من جي بي مورغان وغولدمان ساكس ووكالة معلومات الطاقة يتوقعون انخفاض برنت إلى 70-85 دولاراً خلال 3-6 أشهر من إعادة فتح هرمز.
هل ستخفض أوبك الإنتاج لمنع الانهيار؟
أوبك+ لديها 3+ مليون برميل يومياً من الطاقة الفائضة ويمكنها خفض الإنتاج. لكن نمو الإمداد من خارج أوبك بـ 1.8 مليون يومياً في 2026 يحد من نفوذها.
كيف تستعد دول الخليج لانخفاض أسعار النفط؟
السعودية والإمارات وقطر تسرّع التنويع الاقتصادي عبر رؤية 2030 والسياحة والتكنولوجيا. صناديق الثروة السيادية تزيد استثماراتها في القطاعات غير النفطية.
ما نقطة التعادل المالي للسعودية؟
نقطة التعادل المالي للسعودية نحو 80 دولاراً/برميل. كل دولار فوق ذلك يضيف مليارات إلى إيرادات الحكومة، لكن انخفاضاً تحت 80 دولاراً سيتطلب خفض الإنفاق أو زيادة الاقتراض.
هل يجب أن أستثمر في أسهم النفط الآن؟
أسهم النفط تستفيد من بيئة 110$+، لكن نسبة المخاطرة-العائد سلبية للنصف الثاني 2026. فكّر في تقليل التعرض والتحوط بخيارات البيع إذا كنت تحمل مراكز طاقة كبيرة.