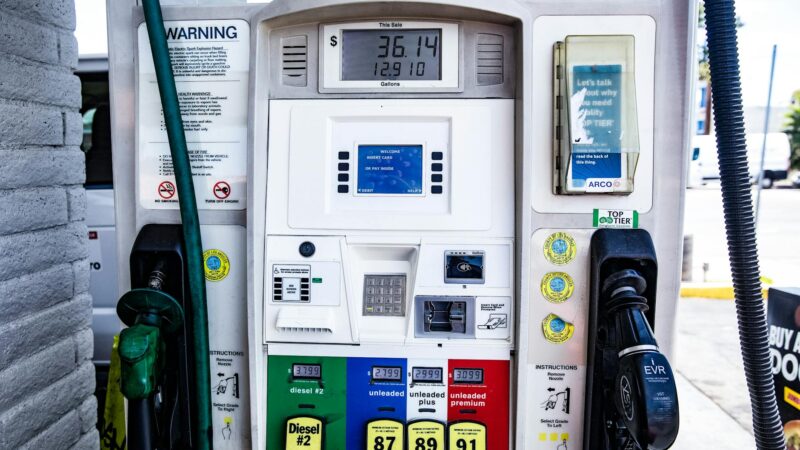
The Iran-US war’s most democratic economic consequence is the one playing out at every gas station in America. In March 2026, the national average price of regular gasoline has climbed to $3.81 per gallon — up from $2.92 on March 1, the day US forces began operations against Iran. That’s a $0.89 increase, or 30.5%, in less than four weeks. For a typical American household driving 15,000 miles per year in a vehicle averaging 28 miles per gallon, the annual fuel cost has increased from approximately $1,564 to $2,040 — an additional $476 per year extracted directly from disposable income. Multiply that across 130 million vehicle-owning households and you get $61.9 billion per year in additional consumer fuel spending — money that is not going to restaurants, retailers, or savings accounts.
Key Takeaways
- National average: $3.81/gal — up 30% from $2.92 pre-war; the single largest 4-week surge since 2022
- California: $5.00+ — Bay Area stations at $5.40–$5.80 for premium; Hawaii at $5.20
- Gulf Coast states: $3.15–$3.30 — lowest in the country due to proximity to US refining and WTI-priced feedstock
- Mid-April projection: $4.20–$4.50 — even without further oil price increases, refinery lag means prices are still catching up
- $61.9 billion annual drain — total additional consumer fuel spending at current prices across 130M US households
What Is Actually Causing the Gas Price Spike?
The chain from the Strait of Hormuz to the American pump is longer than most people realize — and understanding it helps predict when prices peak and what would bring them down. Here is the transmission mechanism in sequence.
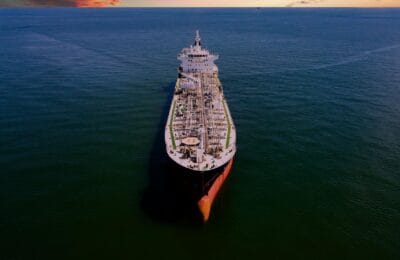
Step 1: Hormuz disruption reduces global crude supply. The strait normally handles 17–18 million barrels per day of crude oil — roughly 20% of global consumption. Current throughput is running at approximately 40% of normal, meaning roughly 10–11 million b/d is missing from global markets. Saudi Arabia, Kuwait, the UAE, Iraq, and Kuwait — all major Hormuz-dependent exporters — are producing at full capacity but cannot deliver.

Step 2: Global crude prices rise. Brent crude has risen from $78 per barrel before the war to $104.21 on March 26 — a 33.6% increase. Crude oil accounts for roughly 55–60% of the retail price of gasoline in the US, with the remainder split between refining (15%), distribution and marketing (15%), and taxes (federal 18.4¢ + state, averaging 10–12% of total price).
Step 3: Refinery margin expansion amplifies the increase. As global crude prices rise, US refiners processing domestic WTI crude (which has risen less than Brent) are seeing their crack spreads — the margin between input cost and output price — widen dramatically. Those wider margins mean refiners are capturing more profit per gallon, but they also mean retail prices are rising faster than crude alone would justify. The Brent-WTI spread of $12 is enabling a structural arbitrage that benefits US refiners at the expense of global consumers.
Step 4: Distribution lag adds time delay. Crude oil drilled today takes 4–6 weeks to become gasoline at a pump. Changes in crude prices therefore show up at the pump with a delay — meaning current retail prices still haven’t fully reflected the crude prices of two to three weeks ago. Analysts estimate $0.15–$0.20 of additional price increases are already “in the pipeline” based on crude prices from mid-March, before the current $104 Brent level.
State-by-State: Who Is Paying the Most and Why?
California ($5.00–$5.80): California has the highest gas prices in the continental US for structural reasons that predate the Iran war: the state requires a unique summer-blend gasoline formula that only a handful of in-state refineries can produce, creating a supply island. The state also carries the highest gas tax ($0.579/gal state tax + carbon cap surcharge). The Iran war added approximately $1.50 per gallon to California prices from their pre-war level of $3.50–$3.70, pushing premium grades above $5.50 in urban markets.
Hawaii ($5.20): Hawaii’s prices reflect its geographic isolation — all petroleum products must be shipped, adding $0.40–$0.60 per gallon in transportation cost versus mainland benchmarks. War-driven shipping cost increases have amplified that isolation premium.
Northeast ($4.20–$4.50): The Northeast — New York, Massachusetts, Connecticut, New Jersey — pays above the national average due to high state taxes (New York at $0.462/gal, Pennsylvania at $0.576/gal), older refinery infrastructure, and pipeline constraints. New England is particularly exposed because it relies heavily on refined product imports that transit war-affected shipping lanes.
Midwest ($3.85–$4.10): Midwest prices are above average but below coastal levels due to proximity to the Cushing, Oklahoma crude hub and multiple mid-continent refineries processing WTI at discounts to Brent. The region’s heavy manufacturing base means high diesel consumption, and diesel prices have risen faster than gasoline — diesel now averaging $4.40/gal nationally, up from $3.20 pre-war.
Gulf Coast ($3.15–$3.30): Texas, Louisiana, Mississippi, Alabama, and Arkansas are the cheapest fuel markets in the nation. The region hosts the country’s largest refining complex (the Gulf Coast accounts for nearly 50% of US refining capacity), processes domestically produced WTI crude, and has the lowest state tax burdens. These structural advantages have cushioned the war’s impact more than anywhere else.
When Will Gas Prices Peak?
The honest answer is: it depends entirely on when the Iran war de-escalates. But analysts can model the scenarios with reasonable precision.
If Brent stabilizes at $100–$110 (base case): Prices continue to drift up through April as the refinery lag works through the system. GasBuddy projects a national average peak of $4.20–$4.50 in late April to early May, followed by a gradual decline as summer driving season demand competes with Hormuz reopening uncertainty. This is the most likely scenario.
If Brent spikes to $120–$130 (escalation scenario): A national average of $5.00+ becomes possible — an unprecedented level outside California. California would see $6.50+ in some markets. This scenario requires an escalation event: Iran mining the strait, attacking Gulf oil infrastructure, or a major shipping incident. Probability: approximately 20%.
If a ceasefire is announced (de-escalation scenario): Crude prices could drop $15–20 in days, with pump prices following in 4–6 weeks. A return to sub-$3.20 national average is achievable within 60 days of a genuine, verified ceasefire. Probability: approximately 25%.
What Is the CPI Impact — and Does the Fed Care?
Gasoline carries a 3.5–4% weight in the Consumer Price Index — small individually, but energy price movements ripple through every category of the index via transportation and manufacturing costs. The March CPI reading, due April 10, will capture the full effect of the first four weeks of war-driven fuel price increases. Economists from Pantheon Macroeconomics and JPMorgan estimate the gasoline price surge alone will add 0.4–0.6 percentage points to March CPI, pushing the headline rate above 4% for the first time in 14 months.
The Federal Reserve’s dilemma is acute. Its mandate — 2% inflation — is being violated by a supply shock it cannot influence with interest rates. Hiking rates to fight oil-driven inflation would destroy demand and trigger a recession without reducing fuel prices. Cutting rates to support growth would validate an inflation overshoot. The Fed is likely to maintain its current 4.25%–4.50% target through Q2 and frame the energy spike as “transitory” — the same word it famously used in 2021, to painful retrospective embarrassment. Markets should not expect rate policy to meaningfully respond to war-driven inflation until the war itself de-escalates.
Is This a Political Crisis for the White House?
Presidents do not control gas prices, but they own them politically. The correlation between gasoline prices and presidential approval ratings is one of the most robust in American political science. Every $0.50 increase in the national gas average historically corresponds to approximately a 2–3 percentage point drop in presidential approval, all else equal.
From $2.92 pre-war to $3.81 today, that’s an $0.89 increase — implying a 3–5 point approval drag. If prices reach $4.50 by mid-April, the total increase of $1.58 from pre-war levels would historically correspond to a 6–9 point approval erosion. Combined with the 59% of Americans who already say the war was a mistake (Pew, March 22), the political math creates a powerful incentive for the White House to pursue a face-saving exit from the conflict before summer — which, ironically, is the most credible argument for why a ceasefire deal emerges in April or May.
Congress has reacted as it typically does: with hearings, finger-pointing, and proposals unlikely to become law. A bill to release 100 million barrels from the Strategic Petroleum Reserve (SPR) has passed committee but faces Senate objections. The SPR currently holds 380 million barrels — enough to cover approximately 20 days of total US oil consumption. An SPR release would provide modest price relief ($0.10–$0.20 per gallon) but is not a structural solution.
What This Means for US Investors
The $3.81 average is already pricing stress into consumer-facing companies — look for April earnings guidance cuts from restaurants (Darden, McDonald’s), general merchandise retailers, and auto-related services as consumers redirect spending to fuel. Conversely, US refiners (VLO, MPC, PSX) and tanker operators benefit from the exact dynamics hurting consumers. For macro traders, the March CPI print (April 10) will be the first clean look at war-driven inflation — a reading above 4.2% would increase pressure on the Fed and could temporarily support the dollar and pressure growth stocks. Watch SPR release news as a short-term crude price depressant that could provide a small pump-price relief rally.
What Would Bring Prices Down Fast?
Three events could materially reduce US gas prices within 4–6 weeks: First, a ceasefire or credible peace framework that signals Hormuz reopening — this is the most powerful price-reduction catalyst and would deliver $0.40–$0.60 per gallon relief. Second, an OPEC emergency reserve release of scale — but most OPEC members face the same Hormuz logistics problem, and the deliverable supply impact would be modest. Third, a large SPR release by the US government — politically viable, logistically executable, but limited to $0.10–$0.20 in pump price relief, buying time rather than solving the problem.
What will not bring prices down: social media pressure campaigns, congressional hearings, windfall profit taxes on oil companies (which reduce investment incentives without reducing near-term supply), or appeals to domestic shale producers to pump more (US shale is near capacity). The only real solution is fewer ships stuck off Hormuz — and that requires a political resolution to the conflict.
Frequently Asked Questions
Why are gas prices so different by state?
Four factors drive state-level price variation: state fuel taxes (range from $0.09/gal in Alaska to $0.58/gal in Pennsylvania), proximity to refining capacity, pipeline and distribution infrastructure, and regional crude oil benchmarks. California also requires a proprietary gasoline blend not produced outside the state, creating a structural supply premium that amplifies all crude price increases.
How quickly do gas prices fall when oil prices drop?
The asymmetry is well-documented: gas prices rise faster than they fall. When crude prices drop, retailers typically pass on savings over 4–8 weeks rather than immediately. The reverse is also true — a ceasefire announcement would take 4–6 weeks to fully translate to pump price relief even if Brent dropped $20 overnight. There is also inventory-buffer dynamics: refiners holding pre-bought high-cost crude will sell through that inventory before cutting retail prices.
Will an SPR release actually lower gas prices?
Modestly. A 100 million barrel SPR release — the volume currently proposed in Congress — represents about 5.5 days of total US oil consumption. Energy economists estimate this provides $0.10–$0.20 per gallon in near-term price relief. It’s a political signal as much as a practical solution. The last major SPR release (2022, in response to Russia-Ukraine) produced approximately $0.25/gal relief over six weeks before crude prices reasserted themselves.
Are windfall profit taxes on oil companies a solution?
No — they reduce investment without reducing near-term supply. Windfall profit taxes increase government revenue from oil company profits but have no mechanism to lower pump prices. If anything, they discourage the domestic production investment that could reduce US import dependence over time. The UK implemented a windfall tax on North Sea producers in 2022; it raised revenue but did not lower UK pump prices and was cited by several producers as a reason to reduce future investment.
Could gas prices stay above $4 permanently?
If the Iran conflict creates structural, multi-year changes to Middle East oil logistics — new routing patterns, persistent insurance premiums, stranded infrastructure — then a permanently higher global crude price floor is possible. Most energy economists don’t see $4+ US national averages as permanent absent a structural supply shock; the $3.50–$4.00 range is considered the “new normal” under a prolonged conflict, with prices returning to $3.00–$3.20 within 60 days of a ceasefire.
Conclusion: The Pump Is Where the War Comes Home
Abstract geopolitical conflicts become viscerally real when they show up at the gas pump. The Iran war’s 30% increase in national gas prices — with more to come — is the single most politically consequential economic effect of the conflict for the American public. It is inflating CPI, straining household budgets, pressuring consumer-facing businesses, and generating the political feedback loop that will ultimately shape when and how the war ends. The $3.81 average is not the ceiling. But understanding the transmission mechanism — Hormuz to Brent to refinery to pump — is the first step to understanding when the ceiling arrives, how high it gets, and what event finally brings it back down. The answer to all three is the same: Iran.