Key Takeaways
- US fertilizer prices up 25–40% since February 28 — urea at the New Orleans benchmark (NOLA) hit $520/short ton in March 2026, up from $390 pre-war
- Gulf region supplies 30%+ of global urea and ammonia — Saudi Arabia, Qatar, and Iran collectively represent the world’s largest nitrogen fertilizer export cluster
- IEA specifically flagged fertilizer supply disruption — the International Energy Agency’s March 2026 emergency assessment cited fertilizer as a top-3 economic impact of Hormuz disruption
- Spring planting timing is brutal — US corn, soybean, and wheat farmers need to apply fertilizer March–May; delayed orders cannot be easily deferred
- Food CPI transmission is 6–9 months — fertilizer cost spikes today reach grocery store prices by September–November 2026
Here is a fact that most American consumers do not know: the food on your table has a supply chain that runs through the Strait of Hormuz. Not the food itself — but the fertilizer that grew it. And right now, that supply chain is under severe stress.
The US-Iran conflict that began February 28, 2026 has disrupted one of the world’s most consequential but least-discussed commodity flows: Gulf-sourced nitrogen and phosphate fertilizers. The Gulf Cooperation Council countries — led by Saudi Arabia and Qatar — plus Iran itself supply more than 30% of global urea exports and roughly 25% of global ammonia trade. When that supply is threatened, the price signal reaches US farmers within days, not months.
US corn farmers in Iowa, wheat farmers in Kansas, and cotton farmers in Texas are already experiencing it. Fertilizer prices at the critical New Orleans (NOLA) barge terminal — the benchmark for US Midwest delivery — have surged 25–40% since February 28, from approximately $390/short ton for urea to $520+/short ton as of mid-March 2026. For a typical 500-acre corn operation, that increase adds $15,000–$25,000 in input costs per crop cycle.

Why Does the Gulf Supply So Much of the World’s Fertilizer?
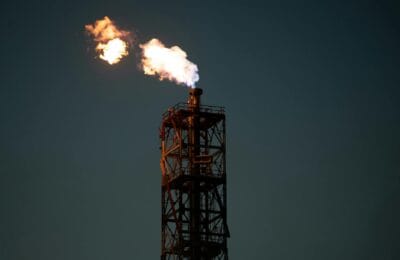
The connection between Gulf oil and gas and global fertilizer supply is structural, not coincidental. Natural gas is both the primary feedstock and the primary energy source for nitrogen fertilizer production. The Gulf region has the world’s cheapest natural gas — often at prices of $0.75–$1.50/MMBtu, versus $2.50–$4.00 in the US and $8–15 in Europe. This gives Gulf producers an insurmountable cost advantage in nitrogen fertilizer manufacturing.
The three largest Gulf fertilizer producers:
1. Saudi Arabian Mining Company (Ma’aden)
Ma’aden’s fertilizer joint ventures with SABIC and Mosaic (the US-listed global phosphate giant) make it one of the world’s largest integrated fertilizer producers. Its Wa’ad Al Shamal phosphate complex in northern Saudi Arabia produces 3.5 million metric tons of diammonium phosphate (DAP) annually — enough to fertilize approximately 35 million acres of US cropland. Ma’aden exports predominantly to India and Southeast Asia but its pricing power affects global markets. Disruption to Ma’aden shipping through the Red Sea and Gulf of Aden (already stressed by Houthi attacks pre-war) would compound the Hormuz problem.
2. Industries Qatar (IQ)
Industries Qatar, listed on the Doha Stock Exchange, operates the world’s largest single-site fertilizer complex through its QAFCO subsidiary. QAFCO produces 5.4 million metric tons of ammonia and urea annually, making Qatar one of the top-3 global urea exporters. Qatar’s proximity to the Strait of Hormuz — and the fact that all QAFCO exports must transit Hormuz — makes it the most Hormuz-exposed major fertilizer producer in the world.
3. OCI Global (Netherlands-listed, UAE-based operations)
OCI operates ammonia and methanol production in the UAE and Oman through its FERTIGLOBE subsidiary (listed on the Abu Dhabi Securities Exchange). FERTIGLOBE produced 5.2 million metric tons of nitrogen fertilizers in 2025 and is a major supplier to the US market through its Iowa Fertilizer Company (IFCo) plant in Wever, Iowa — the only ammonia production facility in the US Midwest using natural gas piped from external sources. Even OCI’s US domestic production is partially dependent on Gulf ammonia imports as feedstock during peak demand.
Iran’s fertilizer production: Before the conflict, Iran produced approximately 4.5 million metric tons of urea annually through its National Petrochemical Company subsidiaries. Under pre-conflict sanctions, most Iranian fertilizer was sold to non-Western markets (Pakistan, Iraq, Afghanistan, East Africa) at steep discounts. The elimination of Iranian export capacity — through both direct damage and intensified sanctions — has removed a significant global supply buffer that kept prices in check.
What Specifically Causes Fertilizer Prices to Rise When Hormuz Is Threatened?
The Hormuz-to-fertilizer price transmission works through three mechanisms:
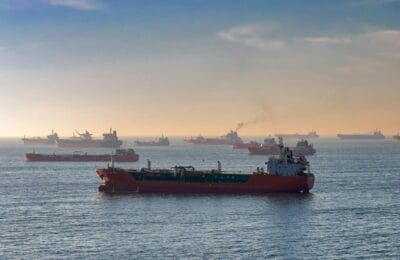
Mechanism 1: Direct supply disruption. Qatar’s QAFCO exports, UAE/Oman FERTIGLOBE shipments, and a portion of Saudi Ma’aden output must physically transit the Strait of Hormuz. If Hormuz is partially or fully closed, these cargoes cannot move. Buyers who contracted for delivery must either find alternative supply (at premium prices) or defer planting — which is not always agronomically possible.
Mechanism 2: Shipping insurance and war risk premiums. Even with Hormuz technically open to non-military traffic, war risk insurance premiums on commercial vessels have surged 600–800% since February 28. A typical urea bulk carrier pays $35,000–$50,000 in insurance per voyage versus $5,000–$7,000 pre-war. This adds approximately $15–25/metric ton to delivered fertilizer costs — a cost that is ultimately passed to farmers.
Mechanism 3: Cape of Good Hope rerouting. Some Gulf fertilizer shipments are now routed around Africa’s southern tip instead of through the Suez Canal and Red Sea, adding 10–14 days of transit time. Container shipping rerouting costs have already spiked significantly. For bulk fertilizer carriers, the additional voyage adds $20–35/metric ton in fuel and time costs.
Why Is the Spring 2026 Timing So Damaging for US Farmers?
Agricultural input cost spikes are always painful, but their timing matters enormously. The spring 2026 fertilizer crisis is hitting at the worst possible moment in the US agricultural calendar:
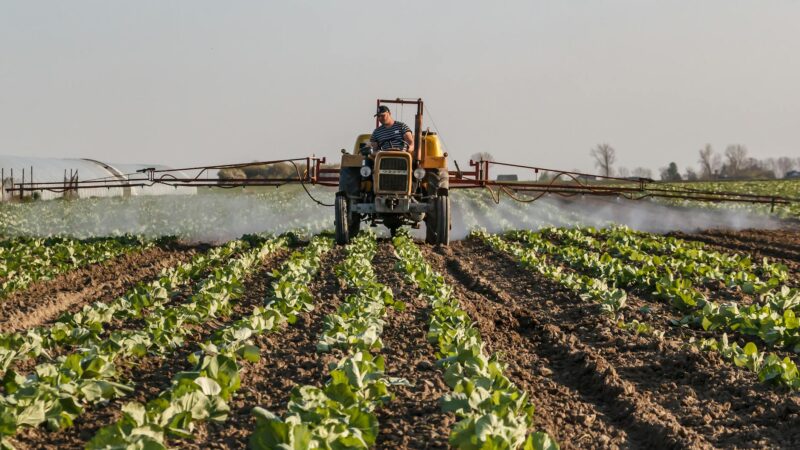
March–May is pre-plant and plant season for US corn. Corn is the largest US crop by both acreage (90M+ acres) and economic value. Nitrogen fertilizer — predominantly urea (46-0-0) and anhydrous ammonia (82-0-0) — must be applied before or at planting. Corn’s nitrogen demand is not deferrable: failing to apply adequate nitrogen at planting means yield losses of 20–40% that cannot be recovered with late applications.
Pre-purchasing and pre-payment timing. Most US grain farmers purchase fertilizer in the fall for spring delivery, locking in prices. But the February 28 war start caught many farmers mid-order cycle. Farmers who had not yet locked in spring 2026 fertilizer contracts before February 28 are now buying at spot prices that are 25–40% higher. The USDA’s Economic Research Service estimates 35–45% of corn farmers had not completed spring 2026 fertilizer procurement before the conflict began.
Soybeans and wheat are also affected. Soybeans (85M acres) use phosphate (DAP/MAP) from Saudi Ma’aden and Moroccan OCP, both of which have experienced price spikes. Winter wheat already in the ground requires spring topdressing with nitrogen — non-negotiable for yield recovery after a dry winter.
The American Farm Bureau Federation estimated in a March 10, 2026 statement that the average US corn farmer’s total input cost per acre has risen from $680 to $810 since January 2026 — a 19% increase — with fertilizer accounting for roughly 60% of that increase.
How Do Fertilizer Prices Reach the Grocery Store?
The food CPI transmission from fertilizer costs operates on a 6–9 month lag, which means the spring 2026 fertilizer crisis will not be fully visible in grocery prices until September–November 2026:
Stage 1 (March–June 2026): Fertilizer purchased at elevated prices; planting proceeds but with tighter margins. Some farmers reduce application rates (yield risk) or shift to less fertilizer-intensive crops.
Stage 2 (July–September 2026): Corn and soybean harvests reflect input costs. Grain elevator bids incorporate higher production costs. CBOT corn and soybean futures adjust.
Stage 3 (October–December 2026): Higher grain costs flow into feed prices for livestock and poultry, processed food ingredient costs, and ethanol production economics. Food CPI components — particularly meat, dairy, bread, and corn-derived products — begin reflecting the supply shock.
The USDA’s most recent (March 2026) Agricultural Projections estimate that a sustained 30% fertilizer price increase, if maintained through planting season, would translate to a 3–5% increase in food-at-home CPI by Q4 2026 — adding approximately $800–$1,400 to an average American family’s annual grocery bill.
What This Means for US Investors
The Iran war-fertilizer-food price chain creates several investment angles. CF Industries (CF) and Mosaic (MOS) — the two largest US-listed fertilizer companies — are direct beneficiaries of higher nitrogen and phosphate prices; both stocks have outperformed since February 28. Agricultural ETFs (DBA, CORN, WEAT) reflect higher commodity prices driven partly by input cost expectations. For fixed-income investors, the food CPI transmission is a legitimate inflation risk factor — sustained food price increases could push the Fed toward a more hawkish stance just as the market expects rate cuts. TIPS and commodity-linked inflation protection instruments are worth reviewing given this scenario. Consumer staple companies with high commodity input exposure (General Mills, Kraft Heinz, Tyson Foods) face margin compression risk in H2 2026.
Are There Any Alternatives to Gulf Fertilizer for US Farmers?
US farmers have limited short-term alternatives but some medium-term options:
Domestic production: US nitrogen fertilizer production (CF Industries, Nutrien’s US plants) covers approximately 45–50% of US nitrogen demand. The gap is imported, primarily from Trinidad & Tobago, Russia (now heavily sanctioned), and the Gulf. Domestic capacity cannot be expanded quickly — new ammonia plants require 4–6 years of permitting and construction.
Canadian sources: Nutrien (NTR), the world’s largest potash producer, is Canadian and supplies US farmers with potash (potassium fertilizer) from Saskatchewan. Potash is less Gulf-dependent than nitrogen. But corn’s primary requirement is nitrogen — and there is no North American substitute for Gulf-priced urea at scale.
Morocco’s OCP: The Office Chérifien des Phosphates controls 70%+ of global phosphate reserves and is Morocco’s national champion. OCP exports from the Atlantic coast (not Hormuz-dependent) and has been actively increasing exports to the US since the Gulf crisis. But phosphate (DAP/MAP) substitutes for nitrogen (urea/ammonia) incompletely — different crops need different nutrient ratios.
Efficiency measures: Variable-rate application technology, soil testing, and precision agriculture can reduce fertilizer use per acre by 10–20%, but adoption takes years and cannot be meaningfully accelerated in a single planting season.
Frequently Asked Questions
Why do Gulf countries matter so much for US fertilizer supply?
Gulf countries — Saudi Arabia, Qatar, UAE, and Iran — collectively produce over 30% of global urea and ammonia exports due to their access to ultra-cheap natural gas (the primary feedstock for nitrogen fertilizers). When Hormuz shipping is disrupted or war risk premiums spike, Gulf fertilizer becomes more expensive to deliver globally, raising US spot prices immediately.
How much have US fertilizer prices increased since the Iran war started?
US urea prices at the New Orleans (NOLA) benchmark increased approximately 25–40% between February 28 and mid-March 2026, rising from roughly $390/short ton to $520+/short ton. Anhydrous ammonia and DAP (diammonium phosphate) have seen similar percentage increases. The American Farm Bureau estimates total farm input costs per corn acre rose 19% since January 2026.
Will the Iran war cause US food prices to rise?
Yes, with a 6–9 month lag. The USDA’s March 2026 Agricultural Projections estimate that a sustained 30% fertilizer price increase would translate to a 3–5% increase in food-at-home CPI by Q4 2026, adding $800–$1,400 to the average US family’s annual grocery bill. Corn, wheat, and soy-derived foods (bread, meat, dairy) are most exposed.
Which US fertilizer companies benefit from higher prices?
CF Industries (CF) — the largest US nitrogen fertilizer producer — and Mosaic Company (MOS) — the largest US phosphate and potash producer — are the primary beneficiaries. Nutrien (NTR), the Canadian-listed world leader in potash and nitrogen, also benefits. All three have seen significant stock price appreciation since the conflict began February 28.
What can US farmers do to reduce fertilizer costs right now?
Short-term options are limited: split applications (applying less at planting and more as side-dress), variable-rate application to target higher-yielding zones, and forward contracting for fall 2026 fertilizer at current prices before further increases. Switching crops to less nitrogen-intensive varieties is feasible for some but disrupts grain contracts already in place. Medium-term, precision agriculture adoption is the most sustainable cost-reduction lever.