Key Takeaways
- 20% of global seaborne oil — the Strait of Hormuz’s pre-war share of global energy trade, now severely disrupted
- +150% container rates — spot rates have more than doubled since February 28 as carriers reroute to the Cape
- 10–14 extra days — the additional voyage time added by Cape of Good Hope routing versus Hormuz/Suez transit
- 21 merchant ship attacks — confirmed incidents on commercial vessels in or near Hormuz waters since hostilities began
- Big four suspended — Maersk, CMA CGM, MSC, and Hapag-Lloyd all halted Hormuz transit; P&I insurance cancelled March 5 for the zone
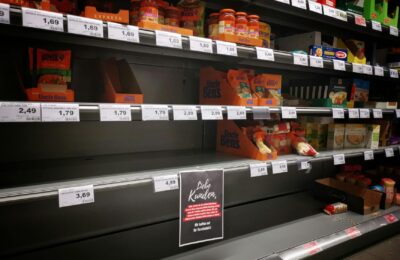
Americans filling shopping carts at Walmart or ordering from Amazon rarely think about the Strait of Hormuz. In March 2026, they are about to start. The Iran war has not just disrupted oil flows — it has fundamentally rerouted the global container shipping network in ways that will drive consumer goods prices higher across the United States over the next 90–180 days.
The mechanism is not complicated: shipping costs are a cost of goods. When the price of moving a container from Shanghai to Los Angeles rises by 150%, that increase does not disappear. It travels through importers, distributors, and retailers until it reaches a price tag. The only variable is timing.
Why Did Shipping Companies Abandon Hormuz So Quickly?
The Strait of Hormuz — the 21-mile-wide chokepoint between Iran and Oman — is the world’s most critical maritime energy corridor. Before the current conflict, approximately 21 million barrels per day of crude oil and refined products transited the strait, representing roughly 20% of all globally traded seaborne oil. For liquefied natural gas, the figures are even more concentrated: approximately 20% of global LNG trade passed through Hormuz, predominantly from Qatar’s North Field.

The decision by the world’s four largest container shipping lines to suspend Hormuz transit was not made reluctantly. It was made because the actuarial math became impossible. Iran’s strike on Qatar’s LNG terminal on March 19 confirmed that no commercial vessel could be considered safe in the broader Gulf zone. By March 5, Protection and Indemnity (P&I) insurers — the syndicates that cover ship owners against third-party liability — had formally cancelled coverage for vessels entering the defined war-risk zone in and around the strait.
Without P&I insurance, no commercial vessel can legally operate. Port authorities will not accept ships without valid P&I certificates. Cargo owners will not ship on uninsured vessels. The insurance cancellation was effectively the moment the strait closed to commercial shipping. Twenty-one confirmed attacks on merchant vessels between the start of hostilities and late March 2026 validated the insurers’ decision.
The Cape of Good Hope: Geography’s Most Expensive Detour
When the Suez Canal was threatened during the Red Sea crisis of 2024, shipping companies briefly rerouted to the Cape of Good Hope. That experience provided a dry run for the current disruption — and the economics were painful even then.
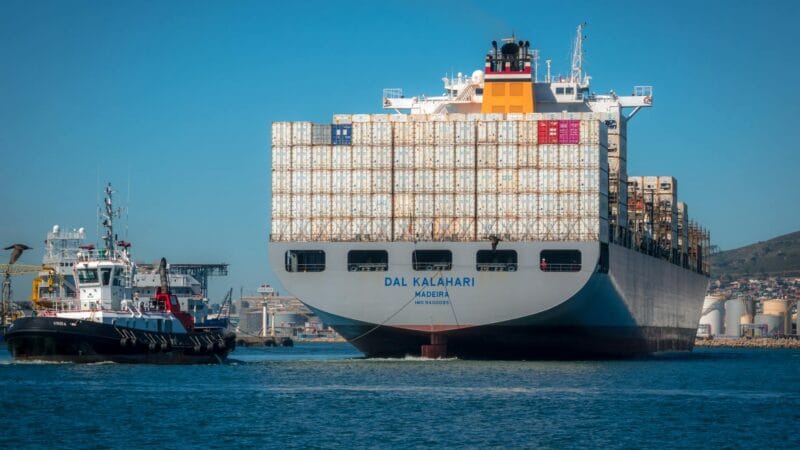
The Cape route adds approximately 10–14 days to a voyage between Asia and Europe, and roughly 7–10 days to routes between the Persian Gulf and European or American ports. For a ship burning 50–80 metric tons of fuel per day, those extra sailing days represent a direct cost increase of several hundred thousand dollars per voyage before any rate adjustment. At fleet scale — Maersk alone operates over 700 vessels — the additional fuel and operating costs run to hundreds of millions of dollars per month.
Carriers pass those costs to shippers via freight rate increases. Since February 28, 2026, spot container rates on major routes have risen approximately 150%. The Shanghai Containerized Freight Index (SCFI), which tracks spot rates across global routes, has reached levels not seen since the peak of the COVID-era supply chain crisis in late 2021. Asia-to-US West Coast rates, which were running around $1,800–$2,200 per 40-foot container before the crisis, have surged above $4,500. Asia-to-Europe rates have moved even more sharply given the proximity to the disruption.
Who Controls the Hormuz Corridor Now?
The effective closure of Hormuz to Western-flagged commercial shipping does not mean all traffic has stopped. India and China — the two largest buyers of Gulf crude — have negotiated preferential passage arrangements for some tankers, though the terms are opaque and the passage is far from guaranteed. The Hormuz split between Eastern and Western buyers has created a two-tier oil market: discounted crude for Asian buyers willing to run the Hormuz gauntlet, and elevated Brent for Western markets relying on Cape-routed supply.
Iranian-flagged and Russian-flagged vessels, operating in what analysts call the “shadow fleet,” continue moving cargo. These are older vessels without Western insurance, operating outside the formal P&I framework. Their cargo is primarily oil for Iran’s own account or for buyers in non-Western markets. They represent a resilience mechanism for sanctioned trade flows, not a solution for global commercial shipping.
Which Shipping Companies Are Most Exposed?
The four carriers that suspended Hormuz transit — Maersk (Denmark), CMA CGM (France), MSC (Switzerland/Italy), and Hapag-Lloyd (Germany) — collectively control approximately 65% of global container shipping capacity. Their simultaneous withdrawal from the route was unprecedented in peacetime maritime history.
Ironically, elevated freight rates are financially beneficial to these carriers in the short term. The same pattern played out during COVID: supply chain disruption that forces rerouting ultimately generates higher per-voyage revenue, even accounting for increased fuel costs. ZIM Integrated Shipping Services, the Israeli-owned carrier listed on the NYSE (ticker: ZIM), and Star Bulk Carriers (SBLK) in the dry bulk segment have seen significant equity appreciation since hostilities began.
US investors watching shipping equities should note the distinction between container carriers and tanker operators. Tanker companies — VLCC (Very Large Crude Carrier) operators in particular — face a more complex picture: some tanker routes through Hormuz are still operating under military escort or preferential arrangements, while others have completely redirected. Companies like Frontline (FRO) and International Seaways (INSW) have experienced outsized volatility.
What Does This Mean for Walmart Shelves and Amazon Deliveries?
The US imports approximately $2.9 trillion in goods annually, with roughly 40% arriving by sea through West Coast ports. The transmission from shipping rate increases to consumer prices is not immediate — it operates through contractual freight agreements, inventory buffers, and retail pricing cycles. But the direction is unambiguous.
For electronics — smartphones, laptops, televisions — which are primarily manufactured in China, Vietnam, and South Korea and shipped via the Pacific, the direct Hormuz impact is limited (these goods do not transit the Gulf). The indirect impact through general freight rate inflation is more relevant. For goods manufactured in South Asia (Bangladesh apparel, Indian pharmaceuticals) or in Gulf-proximate production zones, the cost impact is more direct.
Retail analysts tracking Walmart’s (WMT) import cost exposure estimate that a sustained 150% container rate increase, if maintained for a full quarter, would add approximately $200–$400 million in incremental freight costs to the company’s annual supply chain budget — a cost that would be absorbed partly through margin compression and partly through selective price increases on affected product lines. Amazon (AMZN) faces comparable dynamics across its direct-import private-label businesses.
Food prices are a more immediate concern. Elevated oil prices increase agricultural input costs (fertilizer, pesticide, diesel for farm equipment). Combined with higher shipping costs for imported food commodities, the inflation transmission to grocery prices could become visible to American consumers within 60–90 days.
What This Means for US Investors
Three distinct plays are emerging from the shipping disruption. First, long container shipping equities: ZIM (ZIM), Hapag-Lloyd (HLAG on Frankfurt, or ADRs), and Maersk (MAERSK B) all benefit from elevated freight rates regardless of the routing chaos — their revenue per voyage is rising. Second, short consumer discretionary exposure to import-dependent retailers: companies with high import intensity and thin margins (dollar stores, fast-fashion importers) face cost pressure before pricing power. Third, watch air freight: when sea routes become unreliable, time-sensitive goods shift to airfreight — companies like United Parcel Service (UPS), FedEx (FDX), and air freight operators (Atlas Air) benefit from demand diversion. See also US defense stocks during week three of the Iran war for the broader conflict investment picture.
Frequently Asked Questions
How much of global shipping goes through the Strait of Hormuz?
The Strait of Hormuz handles approximately 20% of global seaborne oil — roughly 21 million barrels per day pre-war — and about 20% of global LNG trade. It is the world’s most critical maritime energy chokepoint. However, it is less central to non-energy container trade than the Suez Canal, meaning the shipping disruption is primarily an energy supply crisis with secondary effects on container goods.
Why did major shipping lines stop using the Hormuz route?
The combination of 21 confirmed attacks on merchant vessels and the cancellation of P&I insurance coverage by marine syndicates on March 5 made Hormuz transit legally and commercially impossible for mainstream carriers. Without valid P&I insurance, vessels cannot enter ports or secure cargo. Maersk, CMA CGM, MSC, and Hapag-Lloyd suspended transit within days of the insurance cancellation.
How much longer is the Cape of Good Hope route?
The Cape of Good Hope detour adds approximately 10–14 days to Asia-Europe voyages and 7–10 days to routes between the Persian Gulf and Western markets. At typical vessel fuel consumption rates of 50–80 metric tons per day, these additional sailing days add several hundred thousand dollars in direct fuel costs per voyage before any rate markup by the carrier.
How long will container rates stay elevated?
Container rates typically normalize within 3–6 months of a disruption if the underlying cause resolves. However, if Hormuz remains closed through Q2 2026, elevated rates are likely to persist at least through mid-year. The COVID comparison is instructive: rates peaked in late 2021 and took nearly 18 months to fully normalize after supply chains stabilized. A faster military resolution would accelerate normalization.
Which US companies are most affected by the shipping disruption?
Import-dependent US retailers face the most direct exposure: Walmart, Target, Dollar Tree, and Amazon’s private-label business all rely heavily on ocean freight from Asia. Technology hardware companies (Apple, Dell) have some exposure though their Pacific routes are less directly affected by Hormuz. US oil refiners benefit indirectly from elevated crude prices, partially offsetting the consumer impact through refinery margin expansion.
The Hormuz disruption is not a shipping story. It is an inflation story. The rerouting of global commerce around the Cape of Good Hope is adding time, fuel, and cost to supply chains that American consumers have come to take for granted. The full price transmission — from shipping contracts to retail shelves — runs on a 90–180 day lag. March 2026’s container rate spike will be visible to American shoppers by summer. The only question is how much of that cost retailers can absorb, and how much becomes a surcharge on ordinary American household budgets.